
Protecting a portfolio from a crash means limiting its maximum drawdown (its largest loss from peak to trough) while weighing the cost to long-term returns. There are three tools: reducing your exposure to equities, diversifying it into uncorrelated assets, or insuring it with put options. This article compares how well they actually worked during crashes, using a backtest on real option quotes from 2008 to 2025 and the main published studies on tail hedging, including those that conclude that insurance costs more than it pays out.
Key figures
- 2008: an S&P 500 portfolio with a budget of 2% a year in deep out-of-the-money put options lost 30.8% at worst, against 51.9% for the index alone, and regained its peak in August 2009 instead of April 2011.
- 2008-2025: the reference strategy (puts 30% out of the money) returned 14.49% a year against 11.11% for the index alone, with a maximum drawdown of -30.6% against -51.9% (Copio backtest on real quotes).
- But: only 2 years out of 18 were winners for the options sleeve (2008 and 2020). On the Nasdaq 100 over 2011-2025, the strategy returned 17.11% a year against 18.73% for the index alone.
- Protection close to the current price: the Cboe PPUT index (puts 5% out of the money) returned 6.6% a year from 1986 to 2018, against 9.8% for the S&P 500.
- AQR (2019): a 60/40 portfolio protected by puts 5% out of the money returned 2 percentage points less a year than the same unprotected portfolio, both over 1986-2011 and over 2011-2019.
The three ways to protect yourself from a crash
| Method | How it protects | What it costs | When it fails |
|---|---|---|---|
| Reducing exposure (more cash or government bonds) | Fewer equities, so a smaller loss in a crash | Lower returns, every year, whether there is a crash or not | Cash can still lose purchasing power, and government bonds can fall when interest rates rise |
| Diversifying (gold, government bonds) | Assets that rise, or fall less, when equities drop | The lower return of safe-haven assets | When the correlation flips: bonds and equities fell together in 2022 |
| Insuring (put options) | A contract that gains value when the index falls sharply | A premium paid every year, lost if there is no crash | In slow declines and calm periods |
| Stop-loss orders and mechanical selling | Selling automatically after a fall | Execution losses and missed rebounds | In sudden crashes and on false signals |
Diversification and its limits are covered in detail in our article on correlations between asset classes, and the behaviour of each safe haven in our study of the crashes from 2000 to 2022. This article focuses on insurance with options.
What is a put option, and why "out of the money"?
A put option gives the right to sell an asset at a price fixed in advance, the strike price. Exercise is possible before expiry for American-style options and only at expiry for European-style options. The buyer pays a premium. A put is said to be out of the money when its strike price is below the current price: a put 30% out of the money on an index at 5,000 points has a strike price of 3,500 points.
The further the put is from the current price, the less it costs, and the more violent the fall needed for it to pay out. That is the whole trade-off: protection close to the current price pays out often and costs a lot, distant protection costs little and only pays out in real crashes.
The backtest: 18 years of S&P 500 options, real quotes
We reproduced the deep out-of-the-money put protection strategy (tail hedging) popularised by Universa Investments and Mark Spitznagel, using the open-source engine options_portfolio_backtester and real end-of-day quotes for options on the SPY ETF, from January 2008 to December 2025. Options are bought at the ask price and sold at the bid price: the bid-ask spread is paid. Purchases and sales use quoted prices. Missing daily marks for held contracts are replaced by intrinsic value, which can understate time value.
Rules: a 100% S&P 500 portfolio. Every two months, buy puts 30% out of the money with 90 to 180 days to expiry, for a budget of 2% of the portfolio a year. Each put is sold when it has 30 days left, and the proceeds are reinvested in equities.
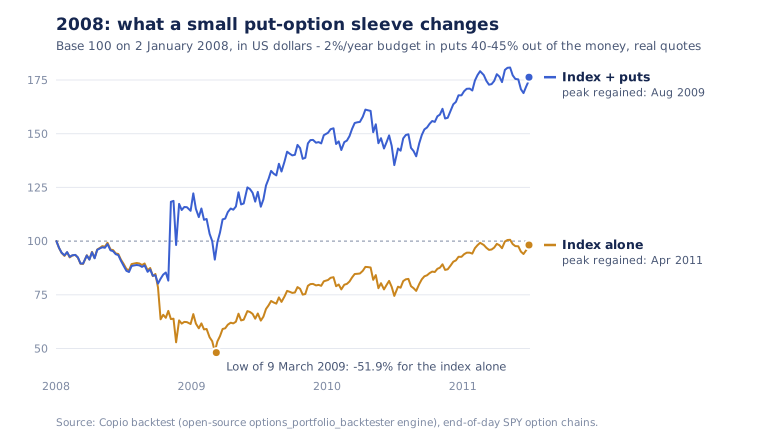
The 2008 chart uses puts 40% to 45% out of the money. The following reference results use puts 30% out of the money; these are different backtest configurations.
Results over 2008-2025
| Portfolio | Annual return | Maximum drawdown | Sortino ratio | Premium actually spent |
|---|---|---|---|---|
| S&P 500 alone | 11.11% | -51.9% | 0.68 | |
| S&P 500 + puts 30% out of the money (budget 2%/year) | 14.49% | -30.6% | 0.97 | 1.60% a year |
The effect comes from convexity. In September 2008, a put bought for $2,920 was sold for $360,620 in November, 123 times the stake. In January 2020, a $12,496 position was sold for $860,520 on 18 March, 69 times the stake. The proceeds, reinvested in equities the same day, did the rest. In March 2020, the put was sold while the index was still 5.7% above the strike price: its entire gain came from the spike in volatility, not from the index falling below the strike. And the sale is not triggered by the crash: it happens on a fixed date, 30 days before expiry. In 2020 it fell five days before the market bottom, which was as much luck as method.
The budget sets the size of the effect, not its sign
| Annual budget | Premium actually spent | Return difference vs S&P 500 alone | Maximum drawdown |
|---|---|---|---|
| 0.5% | 0.40% | +1.04 points | -43.7% |
| 1% | 0.80% | +1.93 points | -35.4% |
| 2% | 1.60% | +3.38 points | -30.6% |
| 3.3% | 2.65% | +4.78 points | -30.0% |
| 5% | 4.02% | +6.06 points | -29.2% |
The selling rule matters more than the choice of put
Selling the puts 30 days before expiry is positive for every depth tested (20% to 40% out of the money). Selling them at 45 or 60 days is negative in every case, with a maximum drawdown of around -46%, barely better than the index alone: the premium is paid, but the put is sold before it becomes truly protective. Every attempt to "improve" the exit (taking profits at 3 to 20 times the stake, a trailing stop, laddering) made the result worse.
Why this result is not a forecast
This backtest is favourable, and it is worth saying why.
| Period and index | With puts | Index alone | Annual difference | Maximum drawdown with puts / alone |
|---|---|---|---|---|
| S&P 500, 2008-2025 | 14.49% | 11.11% | +3.38 points | -30.6% / -51.9% |
| S&P 500, 2011-2025 (excluding 2008) | 14.40% | 14.02% | +0.37 points | -28.3% / -33.7% |
| Nasdaq 100, 2011-2025 | 17.11% | 18.73% | -1.62 points | -35.2% / -35.1% |
| Russell 2000, 2008-2025 | 10.55% | 7.02% | +3.53 points | -38.4% / -54.9% |
- Almost all of the excess return comes from 2008. Removing the financial crisis from the period cuts the advantage from +3.38 to +0.37 percentage points a year. On the Nasdaq 100 since 2011, the protection costs 1.62 points a year. Eighteen years contain only about two and a half exploitable crashes: a result that depends this heavily on a few events cannot establish a future return premium. Halving the historical excess return would not turn it into a reliable forecast.
- Without a crash, the premium is pure cost. Over 2012-2018, a period with no crash deep enough for a put 30% out of the money to pay out, the strategy cost exactly the premium spent: -0.43 points a year with a budget of 0.5%, -2.83 points with 3.3%.
- Only 2 years out of 18 are winners for the options sleeve (2008 and 2020): 5 winning trades against 91 losing ones. You have to be able to sit through sixteen years of steady losses without abandoning the strategy.
- Slow declines are not covered. Over the dot-com bubble (2000-2002), a fall of 47.5% spread over two and a half years, a simulation of the same strategy with modelled option prices (the dataset used contains no quotes before 2008) shows no protection at all: -48.9% against -47.5%.
- Real costs are underestimated. The backtest pays the bid-ask spread but not commissions or market impact. The median spread on these puts reached 19% of the mid price in 2008.
- Tax changes the comparison. Realising an option gain during a crash can trigger tax before the proceeds are reinvested. The result depends on tax residence, account type, loss offsets and the taxation of the equity comparator. The simplified research scenarios are not a verified after-tax return for an investor.
- The data has a limit. The 2008-2025 option quotes come from a public dataset whose original source is no longer documented, and no second free source covers 2008-2009.
- Protection is not continuous. In the reference backtest, no put was held on 3.9% of trading days, including gaps after gains were realised. Missing quotes were replaced by intrinsic value on roughly 10% of deep-put holding days. Both limits matter when interpreting the reported drawdown: the strategy does not guarantee a loss ceiling.
What the published studies say
Against insurance with options. AQR, "Chasing Your Own Tail (Risk)" (Berger, Nielsen, Villalon, 2011) concludes that "experience and financial theory suggest that the long-term cost of such insurance strategies will be larger than the payouts", and that "we think the best way to reduce tail risk is to reduce total market exposure rather than to buy insurance". The 2019 update puts a figure on the cost: a 60/40 portfolio protected by puts 5% out of the money returned 7.0% a year over 2011-2019 against 9.0% without protection, the same 2-point gap as over 1986-2011.
The benchmark index. The Cboe S&P 500 5% Put Protection Index (PPUT) buys puts 5% out of the money every month. According to the Wilshire study for Cboe (2019):
| June 1986 - December 2018 | PPUT (S&P 500 + puts 5% out of the money) | S&P 500 |
|---|---|---|
| Annual return | 6.6% | 9.8% |
| Volatility | 12.1% | 14.9% |
| Maximum drawdown | -38.9% | -51.0% |
| Year 2008 | -20.1% | -37.0% |
| $1 becomes | $8.08 | $20.85 |
Protection close to the current price works during crashes, but its permanent cost more than halves the final capital over 32 years.
For deep out-of-the-money insurance. Universa Investments, advised by Nassim Nicholas Taleb, argues that cutting the largest losses is the most effective way to improve compound returns, on the condition that "risk mitigation needs to be cost-effective" (Universa, 2024). Its protection fund reported +4,144% in the first quarter of 2020, a figure calculated on the small amount of capital allocated to the hedge, not on a whole portfolio. Mark Spitznagel's book, Safe Haven (Wiley, 2021), sets out this thesis.
How to reconcile the two camps. Our reproduction suggests that the disagreement is mainly about sizing. AQR tests puts close to the current price, which are expensive and rolled every month. Universa advocates very distant, cheap puts on a small budget. The two conclusions are compatible: protection close to the current price costs too much to be held over time; distant protection can be held, but its benefit depends on how many sudden crashes you live through.
The failure of "portfolio insurance" in 1987
In the 1980s, the term "portfolio insurance" referred to a different technique: mechanically selling shares or futures contracts as the market falls, to replicate a put synthetically. According to the Brady report commissioned by the White House, $60-90bn of equities were managed this way in October 1987, and the "mechanical, price-insensitive selling by a number of institutions employing portfolio insurance strategies" amplified the crash of 19 October, when the Dow Jones lost 22.6% in a single session (Federal Reserve History). The difference with a purchased put: the put is paid for in advance, and its protection does not depend on being able to sell during the panic.
What about a private investor?
- Index options are available from brokers that offer access to listed options markets (Eurex for the Euro Stoxx 50, Cboe for the S&P 500), usually after a knowledge and experience test, and often with a large contract size. They are held in an ordinary brokerage account. The buyer of an option can lose the entire premium, and in this strategy most premiums are lost.
- The warrants and turbos sold to retail investors are not substitutes: they are debt securities of the issuing bank, with issuer risk, and turbos add leverage and knock-out levels. A study by BaFin, the German financial regulator, found that 74.2% of retail investors in turbos lost money between 2019 and 2023.
- Discipline is the real difficulty. The strategy only works if you keep renewing the protection through years of losses, then sell and reinvest in equities at the height of the crash. That is the opposite of the natural reflex.
Key takeaways
- Every form of protection has a price. Lower returns (reducing exposure), protection that depends on the type of crash (diversification), or an annual premium (options).
- Puts close to the current price protect well and cost too much: around 2 to 3 points of return a year according to AQR and the PPUT index.
- Deep out-of-the-money puts cost little and sharply reduced the losses of 2008 and 2020, but their net benefit depends on the number of sudden crashes in the period, and they do not protect against slow declines.
- Their real value is making a more aggressive allocation bearable. A portfolio whose maximum drawdown falls from -52% to -31% can hold more equities without its owner selling at the worst moment. This is the logic of the "barbell" portfolio: a return-generating core and a small convex sleeve.
Methodology
- Engine: lambdaclass/options_portfolio_backtester, version e53ef86, whose published reproduction tests pass with identical results.
- Data: end-of-day option chains on SPY, QQQ and IWM, January 2008 - December 2025, identified by SHA-256 hash. Bought at the ask price, sold at the bid price. No commissions and no market impact.
- Currency: the quote-based backtest results are in US dollars. A euro investor also has currency exposure; the results are not directly comparable to the euro-denominated asset-class studies linked above.
- Dot-com bubble: since the dataset used contains no option quotes before 2008, the 2000-2007 period uses modelled prices (Black-Scholes with VIX implied volatility and a volatility skew calibrated on later quotes). This result is indicative.
- 2008 chart: variant with puts 40% to 45% out of the money, same budget and same selling rules.
Data as of 23 September 2026.
This article is published for information and educational purposes. It does not constitute personalised investment advice. Options are complex products that can result in the total loss of the premium invested. Past performance is not a reliable indicator of future performance.