In a stock market crash, not every asset class falls together, but the list of safe havens changes from one crash to the next. This study measures, in euros, the maximum drawdown (max. loss), the three-year return and the recovery time of 15 asset classes during four crises: the dot-com bubble (2000), the financial crisis (2008), Covid (2020) and the inflation and interest-rate shock (2022). All the data can be downloaded at the end of the article.
Key figures
- Equities: between -40% and -67% in each of the two major crises of 2000 and 2008, across every region. The DAX lost 66.7% between February 2000 and February 2003.
- Government bonds: -2% to -3.5% at worst in 2000 and 2008, then -21.2% for euro government bonds in the 2020-2022 rate shock.
- Gold in euros: maximum drawdown between 8.8% and 13.3% in all four crises, and +82.8% over the 2008 crisis window.
- High yield: -34.2% in 2008. It behaves like equities.
- Recovery: 13 years and 3 months for the S&P 500 in euros after its August 2000 peak, almost 18 years for Japanese equities, more than 24 years for gold after its 1983 peak.
Source for figures without a link: Copio calculation on public index series, month-end values, in euros. Methodology at the end of the article.
The four crashes in one table
Maximum drawdown (peak to trough, month-end values, in euros) and total return over each crisis's three-year window.
| Asset class | Dot-com bubble (2000-2003) | 2008 crisis (2007-2010) | Covid (2020-2023) | Rate shock (2021-2024) |
|---|---|---|---|---|
| US equities (S&P 500, dividends reinvested) | -52.5% / -42.1% | -44.1% / -16.9% | -18.9% / +35.4% | -13.0% / +41.0% |
| European equities (STOXX Europe 600) | -51.9% / -50.2% | -53.7% / -24.5% | -21.6% / +18.2% | -18.6% / +12.6% |
| French equities (CAC 40, dividends reinvested) | -56.4% / -52.6% | -51.7% / -26.8% | -24.1% / +31.7% | -17.1% / +13.1% |
| German equities (DAX) | -66.7% / -66.7% | -52.4% / -20.8% | -23.7% / +16.5% | -23.7% / +25.3% |
| Japanese equities (MSCI Japan IMI) | -63.8% / -60.5% | -39.8% / -22.9% | -15.6% / +5.6% | -13.4% / +17.5% |
| Emerging-market equities (MSCI EM IMI) | -49.1% / -48.2% | -56.4% / +1.0% | -21.7% / +8.9% | -18.6% / +4.5% |
| Euro government bonds | -2.1% / +26.8% | -3.5% / +20.7% | -21.2% / -17.4% | n/a |
| Global government bonds (EUR-hedged) | -1.6% / +27.5% | -2.1% / +20.2% | -14.8% / -9.8% | -16.0% / -9.4% |
| Euro corporate bonds | n/a | -5.0% / +21.3% | -16.8% / -12.5% | -15.2% / -3.8% |
| Euro high-yield bonds | n/a | -34.2% / +13.6% | -15.0% / -2.4% | -13.6% / +8.2% |
| Euro inflation-linked bonds | n/a | -6.4% / +18.6% | -12.2% / -1.2% | -12.2% / -4.2% |
| Gold (in euros) | -10.5% / +6.6% | -12.5% / +82.8% | -13.3% / +23.9% | -8.8% / +56.4% |
| Commodities | -16.7% / +27.4% | -40.3% / -2.7% | -13.3% / +80.5% | -18.4% / +28.9% |
| Euro cash (money market) | 0.0% / +12.6% | 0.0% / +6.2% | -1.2% / -0.7% | -0.3% / +7.5% |
| Listed real estate (FTSE EPRA Nareit Developed) | n/a | n/a | n/a | -25.7% / -6.1% |
How to read it: maximum drawdown / total return over the window. n/a: series not available for the window. Windows: February 2000 - February 2003, September 2007 - September 2010, January 2020 - January 2023, December 2021 - December 2024. Because the windows are fixed, some declines continue beyond them (measured from its August 2000 peak, the S&P 500 in euros did not hit its low until February 2009, at -60.2%).
2008 versus 2022: two crashes, two lists of safe havens
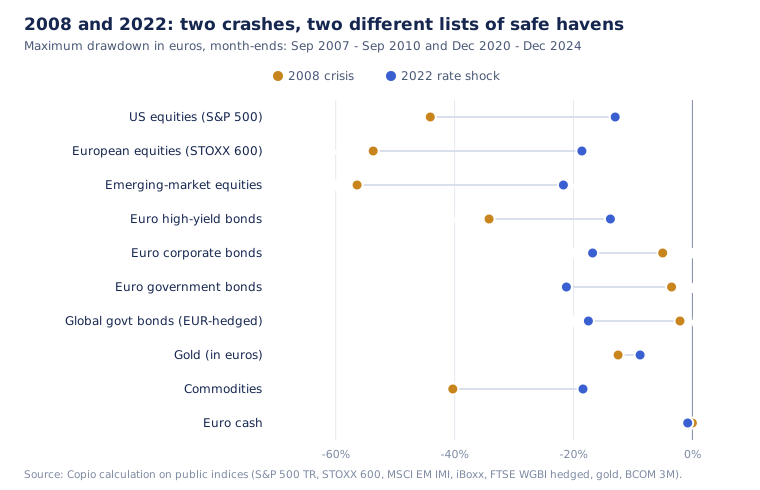
The chart measures the rate shock from December 2020 to December 2024, or the end of each available series. This captures bond peaks before 2022. The table above uses December 2021 to December 2024, so some drawdowns differ.
The difference comes down to the cause of the crash:
- Growth crash (2000, 2008): earnings and employment fall, central banks cut interest rates, and government bond prices rise. Government bonds and cash protect. Everything that depends on the health of companies falls: equities, high yield, commodities.
- Inflation crash (2022): central banks raise interest rates sharply. Stocks and bonds fall together. Euro government bonds lost 21.2% between December 2020 and December 2022, and global government bonds (EUR-hedged) had still not regained their November 2021 peak by the end of April 2026.
This shift matches the change of sign in the correlation between stocks and bonds, analysed in our article on diversification.
How long does it take to regain the previous peak?
The worst decline of each asset class over its full available history, in euros, and the time spent below the previous peak.
| Asset class (history) | Worst decline | Peak | Trough | Peak regained | Time below peak |
|---|---|---|---|---|---|
| Gold in euros (1970-2026) | -54.0% | January 1983 | July 1999 | September 2007 | 24 years 8 months |
| Japanese equities (1994-2026) | -66.2% | March 2000 | May 2003 | February 2018 | 17 years 11 months |
| Global equities, excluding dividends (1999-2026) | -60.0% | August 2000 | February 2009 | February 2015 | 14 years 6 months |
| Commodities (1991-2026) | -45.0% | June 2008 | March 2020 | February 2022 | 13 years 8 months |
| S&P 500, dividends reinvested (1999-2026) | -60.2% | August 2000 | February 2009 | November 2013 | 13 years 3 months |
| Emerging-market equities (1994-2026) | -59.2% | July 1997 | September 1998 | September 2005 | 8 years 2 months |
| German equities, DAX (1999-2026) | -68.3% | February 2000 | March 2003 | May 2007 | 7 years 3 months |
| European equities, STOXX 600 (1987-2026) | -54.3% | May 2007 | February 2009 | December 2013 | 6 years 7 months |
| French equities, CAC 40 dividends reinvested (1991-2026) | -58.5% | August 2000 | March 2003 | January 2007 | 6 years 5 months |
| Euro high-yield bonds (2006-2026) | -35.5% | May 2007 | December 2008 | January 2010 | 2 years 8 months |
| Euro government bonds (1999-2023) | -21.2% | December 2020 | December 2022 | not regained by January 2023, end of series | more than 2 years |
| Global government bonds, EUR-hedged (1985-2026) | -17.5% | November 2021 | October 2023 | not regained by April 2026 | more than 4 years |
Two observations. Equities in euros have gone through wilderness years of 13 to 18 years when the crash started from extreme valuations (the dot-com bubble, Japan). And gold, often presented as the ultimate safe haven, holds the record for the longest spell below its peak in this table.
For an investor in euros, currency matters too: the dollar lost ground against the euro between 2002 and 2008, which lengthened the recovery of US equities measured in euros.
The major US crashes since 1929
To place recent crises in the long sweep of history, here are the major S&P 500 bear markets, based on closing prices in dollars, according to Yardeni Research.
| Crash | Peak | Trough | S&P 500 decline |
|---|---|---|---|
| Great Depression | September 1929 | June 1932 | about -86% |
| Oil shock | January 1973 | October 1974 | -48.2% |
| 1987 crash | August 1987 | December 1987 | -33.5% |
| Dot-com bubble | March 2000 | October 2002 | -49.1% |
| Financial crisis | October 2007 | March 2009 | -56.8% |
| Covid | February 2020 | March 2020 | -33.9% |
| Rate shock | January 2022 | October 2022 | -25.4% |
The 1929-1932 figure is calculated from prices published by Yardeni (31.92 on 7 September 1929, 4.40 on 1 June 1932). For the Dow Jones, Federal Reserve History reports a decline of 89% up to the summer of 1932 and a return to the peak in November 1954. On 19 October 1987, the Dow Jones lost 22.6% in a single session, according to Federal Reserve History.
The asymmetry of losses
A loss always requires a larger gain to make it up.
| Loss | Gain needed to get back to the starting point | Example |
|---|---|---|
| -10% | +11.1% | Ordinary correction |
| -25.4% | +34.0% | S&P 500 in 2022 |
| -33.9% | +51.3% | S&P 500, Covid 2020 |
| -50% | +100% | |
| -56.8% | +131.5% | S&P 500, 2007-2009 |
| -86% | +614% | S&P 500, 1929-1932 |
This is why a long-term portfolio should be judged first by its worst possible loss, and only then by its return. A loss you can absorb without selling at the bottom only costs you time. A loss that pushes you to sell becomes permanent.
What this data teaches about building a portfolio
- There is no universal safe haven. Government bonds protect against growth crashes, not against inflation crashes. A robust portfolio combines several forms of protection: government bonds, gold, cash.
- Geography does not protect you from an equity crash. In 2008, every region lost between 40% and 57%.
- High yield and listed real estate are growth assets. -34.2% and -25.7% in their worst windows.
- The real risk is duration, not just depth. 13 years underwater for the S&P 500 in euros: that is the horizon you need to be able to hold on for without selling.
- The most patient investors buy during crashes. New Zealand's sovereign wealth fund estimates it would lose 52.6% in a repeat of the 2008 crisis, and it bought equities during the 2008 and 2020 crashes: see how sovereign wealth funds allocate their money over the long term. For strategies that directly limit the maximum drawdown, see what the data says about protecting a portfolio with put options.
Methodology and data
- Data: public indices as month-end values, converted into euros at ECB reference rates where necessary. S&P 500 Total Return and MSCI ACWI excluding dividends (Yahoo Finance), DAX (Yahoo Finance), STOXX Europe 600 net, CAC 40 gross dividends reinvested, MSCI Japan IMI and MSCI Emerging Markets IMI net, iBoxx € Sovereigns, FTSE World Government Bond Index Developed hedged into euros, iBoxx € Liquid Corporates and Liquid High Yield, Bloomberg Euro Government Inflation-Linked, spot gold in euros, Bloomberg Commodity Index 3 Month Forward (via Curvo), EONIA and €STR (ECB), FTSE EPRA Nareit Developed (EPRA).
- Maximum drawdown: the largest fall from a high to a subsequent low, using month-end values. Intra-month falls are larger: for example, the S&P 500 lost 33.9% in dollars between 19 February and 23 March 2020, against 18.9% in euros at month-end.
- Crisis windows: set at three years before the results were analysed.
- Limitations: euro-denominated histories before 1999 are reconstructed by the data providers. No fund fees are deducted. Past performance is not a reliable indicator of future performance.
- Downloads: losses by asset class and by crisis (CSV), worst historical declines and recovery times (CSV).
Data as of 23 September 2026. Free to reproduce with credit to the source: "Copio, calculation on public indices".
This article is published for information and educational purposes only. It does not constitute personalised investment advice. Past performance is not a reliable indicator of future performance.