
Diversification means holding several return engines that do not fall at the same time. It is measured by the correlation between investments, not by the number of holdings in the portfolio. This article publishes the correlations between the main asset classes, calculated in euros over 1989-2026, how they behave during crises, and what these figures imply for building a portfolio.
Key figures
- Between 2006 and 2026, the monthly correlation between global equities (MSCI ACWI) and US equities (S&P 500) is 0.95: holding both means holding the same risk twice.
- Between 2006 and 2026, the correlation between global equities and gold is -0.06, with global government bonds (EUR-hedged) it is 0.03, and with high-yield bonds it is 0.68.
- The correlation between European equities and government bonds was positive from 1990 to 1997 (+0.34 on average), negative from 2000 to 2021 (-0.28), and has been positive again since 2022 (+0.31).
- In 2008, euro government bonds lost 3.5% at worst while European equities lost 53.7%. In 2022, the same bonds lost 21.2%.
- Bitcoin has a correlation of +0.32 with global equities (weekly, 2021-2026): its effect on portfolio risk depends on its weight and high volatility.
Source for figures without a link: Copio calculation on public index series, monthly returns in euros. Methodology and downloadable data at the end of the article.
What is diversification?
The textbook definition: spreading your savings across several investments that do not always move in the same direction at the same time. Professionals call this decorrelation.
A stricter, working definition: a portfolio is diversified when the failure of its main return engine does not destroy it. A return engine is a group of investments that rise and fall for the same reasons. US, European and global equities are a single engine: growth in company earnings. Government bonds are another: interest rates and inflation. Gold is a third.
The number of holdings tells you nothing. A portfolio of ten equity ETFs can be less diversified than a two-holding portfolio made up of a global equity ETF and a government bond fund.
How do you measure diversification? Correlation
Correlation measures how closely two investments move together, on a scale from -1 to +1:
- +1: they rise and fall exactly together. No diversification.
- 0: their returns have no linear correlation. This can reduce portfolio volatility, but does not imply statistical independence or guarantee protection in a crash.
- -1: their returns move in opposite directions. A perfect hedge also requires weights that account for each asset's volatility.
The effect is mechanical. Take two investments with the same volatility, 15% a year, combined in equal parts: with a correlation of 0.95, the portfolio keeps a volatility of 14.8%. With a correlation of 0, it falls to 10.6%. With -0.3, to 8.9%. The expected return, meanwhile, stays the average of the two. This is why diversification is often described, in a phrase attributed to Harry Markowitz, as the only free lunch in finance.
Correlations between asset classes, 2006-2026
Correlations of monthly returns in euros, from January 2006 to July 2026 (January 2023 for euro government bonds, whose series ends there). How to read it: the closer the figure is to 1, the less the pairing diversifies.
| Asset class | Global equities | US equities | Global gov. bonds (EUR-hedged) | Gold | Euro high yield |
|---|---|---|---|---|---|
| Global equities (MSCI ACWI) | 1 | 0.95 | 0.03 | -0.06 | 0.68 |
| US equities (S&P 500) | 0.95 | 1 | 0.07 | -0.09 | 0.54 |
| European equities (STOXX 600) | 0.90 | 0.78 | -0.03 | -0.12 | 0.74 |
| Emerging-market equities (MSCI EM IMI) | 0.79 | 0.62 | -0.03 | 0.08 | 0.68 |
| Euro government bonds | 0.12 | 0.14 | 0.86 | 0.14 | 0.12 |
| Euro corporate bonds | 0.47 | 0.42 | 0.58 | 0.14 | 0.54 |
| Euro inflation-linked bonds | 0.39 | 0.34 | 0.57 | 0.09 | 0.45 |
| Commodities | 0.37 | 0.30 | -0.19 | 0.29 | 0.30 |
| Euro cash (money market) | -0.11 | -0.13 | 0.04 | 0.08 | -0.11 |
Three lessons:
- All equities look alike. Global, US, European and emerging-market equities have correlations of between 0.62 and 0.95. Diversifying your equities geographically reduces the risk of concentration in one country, not equity risk.
- Corporate and high-yield bonds are half equities. High yield has a correlation of 0.68 with global equities and 0.74 with European equities: when the economy falters, default risk rises at the same time as equities fall.
- Three asset classes had low correlations with equities over the period: high-quality government bonds (0.03 to 0.12), gold (-0.06) and euro cash (-0.11).
According to the long-term capital market assumptions published by J.P. Morgan Asset Management (2026 edition, in euros), private equity would have a correlation of 0.76 with global equities and listed real estate (REITs) 0.84: neither is a return engine distinct from equities.
The stock-bond correlation changes sign
This is the most important and least understood fact about diversification: the correlation between stocks and bonds is not a constant.
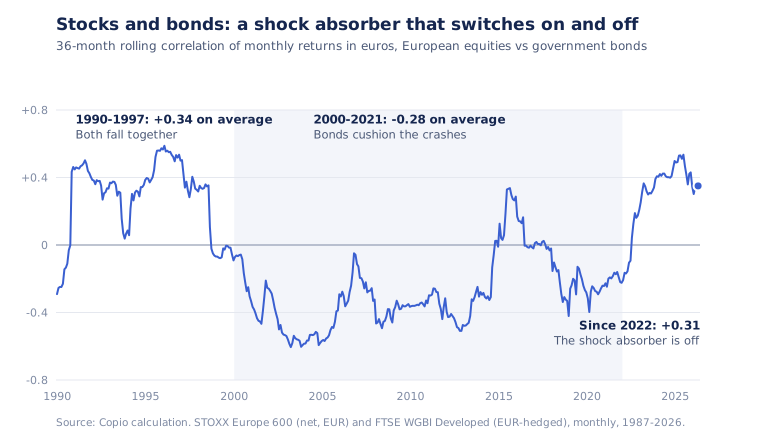
| Period | Average 36-month correlation (European equities vs government bonds) | What it means |
|---|---|---|
| 1990-1997 | +0.34 | Stocks and bonds fall together when inflation and interest rates rise |
| 2000-2021 | -0.28 | Bonds rise when stocks fall: they cushion crashes |
| 2022-2026 | +0.31 | Return of a positive correlation, latest reading +0.35 in April 2026 |
This result is not specific to European data. A study by the Amundi Investment Institute (Roncalli, 2025) measures an average correlation of about +30% before 2000 and -30% after between the S&P 500 and 10-year US Treasuries, and notes that a positive correlation is the historical norm, not the exception. For France, the same study shows the correlation moving from -12.3% at the end of 2019 to +52.9% at the end of 2024. J.P. Morgan notes that since 1940 the stock-bond correlation has been negative only 38% of the time. According to AQR (2023), uncertainty about inflation explains most of these reversals.
The practical consequence: the 60% equities / 40% bonds portfolio benefited from negative stock-bond correlation during 2000-2021. In a regime of uncertain inflation, its bonds no longer protect against every type of crash.
What happens to diversification during a crash?
Academic research has established that correlations between equity markets increase in bear markets. Longin and Solnik (Journal of Finance, 2001) conclude, over 1959-1996, that "correlation increases in bear markets, but not in bull markets". Ang and Bekaert (Review of Financial Studies, 2002) confirm that correlations rise in highly volatile bear markets, while showing that international diversification is still valuable.
Our calculations for four recent crises, showing the monthly correlation of each asset class with global equities over each crisis's three-year window:
| Asset class | Dot-com bubble (2000-2003) | 2008 crisis (2007-2010) | Covid (2020-2023) | Rate shock (2021-2024) |
|---|---|---|---|---|
| European equities | 0.92 | 0.96 | 0.93 | 0.83 |
| Emerging-market equities | 0.83 | 0.91 | 0.77 | 0.61 |
| Global government bonds (EUR-hedged) | -0.58 | -0.39 | 0.33 | 0.65 |
| Euro government bonds | -0.43 | -0.17 | 0.52 | n/a |
| Euro high-yield bonds | n/a | 0.76 | 0.85 | 0.78 |
| Gold (in euros) | 0.08 | -0.22 | -0.11 | -0.14 |
| Commodities | 0.47 | 0.43 | 0.44 | 0.14 |
n/a: series not available for the window. Windows: February 2000 - February 2003, September 2007 - September 2010, January 2020 - January 2023, December 2021 - December 2024.
Gold is the only asset class that stayed uncorrelated with equities in all four crises. Government bonds protected in 2000 and 2008, but not in 2022. High yield did not provide a safe haven in the crises examined. The detailed losses by asset class and by crisis are published in our study Stock market crashes: how each asset class performed.
Does bitcoin diversify?
On weekly returns in euros from October 2021 to September 2026 (254 weeks, Copio calculation on EODHD data):
| Correlation with... | Bitcoin | Ether |
|---|---|---|
| Global equities | +0.32 | +0.38 |
| US equities | +0.27 | +0.31 |
| Euro government bonds | +0.09 | +0.10 |
| Gold | +0.14 | +0.08 |
| Annual volatility | 49.6% | 66.2% |
A correlation of +0.32 combined with volatility three to four times that of equities: bitcoin is a volatile risk exposure, not a reliable crash hedge. A small allocation can provide some diversification, but a large one can increase portfolio volatility. Bitcoin and ether are also correlated with each other at 0.82, so several cryptocurrencies count as a single position.
The five most common diversification mistakes
- Stacking equity ETFs. Global equities + S&P 500 + Nasdaq 100: three holdings, one engine, and an overweight in the same large technology stocks, which already carry a heavy weight in each of the three indices.
- Confusing bonds with government bonds. High yield and, to a lesser extent, corporate bonds behave like equities in a crisis.
- Relying on a past correlation. The stock-bond hedge of 2000-2021 disappeared in 2022.
- Diversifying by product rather than by risk. A "wealth preservation" fund (fonds patrimonial) or a structured product can contain the same equity risk as the rest of the portfolio.
- Leaving crypto out of the count. Five cryptocurrencies are not five sources of diversification.
Methodology and data
- Data: public indices as monthly returns, converted into euros at ECB rates where necessary. S&P 500 Total Return (Yahoo Finance), MSCI ACWI excluding dividends (Yahoo Finance), STOXX Europe 600 net, MSCI Emerging Markets IMI net, iBoxx € Sovereigns, FTSE World Government Bond Index Developed hedged into euros, iBoxx € Liquid Corporates and Liquid High Yield, euro inflation-linked government bonds, spot gold in euros, Bloomberg Commodity Index 3 Month Forward (via Curvo), EONIA and €STR (ECB).
- Correlations: Pearson coefficient on monthly returns, over the common period of each pair between January 2006 and July 2026. Rolling correlation: 36-month window.
- Limitations: the MSCI ACWI index used excludes dividends. Euro-denominated histories before 1999 are reconstructed by the data provider. Past correlations do not guarantee future correlations, as the 2022 reversal illustrates precisely.
- Downloads: correlation matrix 2006-2026 (CSV), rolling stock-bond correlation 1989-2026 (CSV).
Data as of 23 September 2026. Free to reproduce with credit to the source: "Copio, calculation on public indices".
Further reading
On building an asset allocation, read how sovereign wealth funds allocate their money over the long term and what the data says about protecting a portfolio with put options.
This article is published for information and educational purposes only. It does not constitute personalised investment advice. Past performance is not a reliable indicator of future performance.