
Asset allocation is how a portfolio is split between the major asset classes, and it is the decision that determines most of its risk and return. Sovereign wealth funds are the investors who practise it with the longest horizon and the greatest transparency. This article compares the allocation, rules and returns of four of them, from New Zealand, Norway, Australia and France, then draws out the principles that can be applied to an individual's portfolio.
Key figures
- NZ Super Fund: reference portfolio of 80% equities / 20% bonds. A return of 10.26% a year since 2003, against 8.89% for its reference portfolio and 3.51% for New Zealand Treasury bills (at 30 June 2026).
- Norwegian fund (GPFG): benchmark index of 70% equities / 30% bonds, rebalanced once it deviates by 2 percentage points. 6.86% a year since 1998, 4.51% after inflation and costs, with management costs of 0.07% a year.
- Australia's Future Fund: a target of inflation + 4% to 5% a year, with 8.3% a year achieved since 2006, and 27% in unlisted and real assets.
- France's Pension Reserve Fund (FRR): equity share raised to 50% in 2025 after its horizon was extended, 4.4% a year since 2010.
- What they have in common: an allocation written down for decades, dominated by growth assets, and a rule of conduct for crashes.
What is a sovereign wealth fund?
A sovereign wealth fund is an investment fund owned by a state, which invests public reserves (oil revenues, budget surpluses, pension reserves) to finance future spending. For a saver, they are interesting because of three features: a horizon of several decades, detailed public reports, and governance that requires the strategy to be written down in advance and justified.
Four sovereign wealth funds compared
| Fund | Size | Reference allocation | Long-term return | Horizon |
|---|---|---|---|---|
| NZ Super Fund (New Zealand) | NZ$94.4bn (June 2026) | 80% equities, 20% bonds | 10.26% a year since 2003 | Withdrawals expected from 2054 |
| GPFG (Norway) | NOK 22,683bn (June 2026) | 70% equities, 30% bonds | 6.86% a year since 1998 | Very long term |
| Future Fund (Australia) | A$289.7bn (June 2026) | Target of inflation + 4% to 5% a year | 8.3% a year since 2006 | No withdrawals before 2032-2033 |
| FRR (France) | €20.7bn (end of 2025) | 50% equities since 2025 | 4.4% a year since 2010 | Payments to Cades until 2033, horizon extended |
Nominal returns in each fund's currency and over different periods. The fee basis varies: NBIM's 6.86% is before management costs; its 4.51% real return is after inflation and costs. Sources: NZ Super Fund, NBIM, Future Fund, FRR.
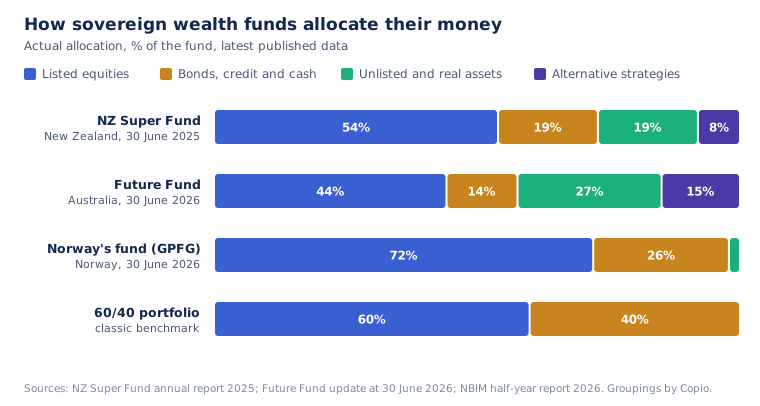
NZ Super Fund: the 80/20 reference portfolio
The New Zealand fund, set up in 2003 to finance future public pensions, is the textbook case of long-term allocation. Its strategy is built on a reference portfolio: a passive, low-cost portfolio that serves as the yardstick for everything the fund does.
| Component | Weight |
|---|---|
| Global equities | 75% |
| New Zealand equities | 5% |
| Global bonds | 20% |
| Currency hedging | 100% hedged into New Zealand dollars |
Source: NZ Super Fund, Reference Portfolio. The fund reviews this portfolio every five years; the review begun in 2025-2026 had not published a new composition as of 23 September 2026.
The rationale is explicit: "In keeping with the Fund's long investment horizon ... we have deliberately weighted the Fund towards growth assets", since it does not need to draw on its capital in the short term. According to the press release of 16 September 2026, withdrawals are now expected to begin in 2054.
The fund also puts a figure on what this choice costs. It estimates that it would lose 52.6% in a repeat of the 2008-2011 financial crisis, and considers that "The major risk to the Fund is that we lose our nerve, close down our investment positions and lock in the losses experienced in a crisis."
What it did during crashes. For 2008, the fund says that "our long-term horizon enabled us to buy cheaper equities and sell them later at higher prices." In March 2020 it was "down 28 percent from its prior peak in late February, losing $13.4 billion" (New Zealand dollars), then rebalanced its portfolio to maintain its risk exposure, "returning 53 percent from its low point", according to its appearance before a parliamentary select committee in March 2021.
The result.
| At 30 June 2026, per year | NZ Super Fund | Reference portfolio | NZ Treasury bills |
|---|---|---|---|
| Since inception (2003) | 10.26% | 8.89% | 3.51% |
| 20 years | 9.68% | 8.19% | 3.15% |
| 10 years | 11.32% | 9.78% | 2.37% |
| 5 years | 8.82% | 6.98% | 3.48% |
Source: NZ Super Fund, performance, after fees, before New Zealand tax.
Two lessons. The simple, passive 80/20 reference portfolio returned 8.89% a year on its own. And the fund beat this benchmark by around 1.4 percentage points a year thanks to active strategies, including "contrarian" rebalancing, which means buying when others are selling. The fund notes that around half of its portfolio remains invested in the assets of its reference portfolio.
The Norwegian fund: 70/30, rules and minimal costs
One of the largest sovereign wealth funds in the world applies the most stripped-down version of long-term allocation.
- Benchmark index: 70% equities and 30% bonds since May 2019, with the bond portion split 70% government bonds and 30% corporate bonds (NBIM).
- Rebalancing rule: when the equity share of the index deviates from 70% by more than 2 percentage points at month end, the index is brought back to its target. In practice, the fund buys equities after a fall and sells them after a rise.
- Unlisted assets: up to 7% in unlisted real estate and 2% in renewable energy infrastructure (NBIM). At 30 June 2026, they made up only 2.1% of the fund.
- Diversification: 7,201 companies in the portfolio at the end of 2025, for an average holding of 1.5% of every listed company in the world (2025 annual report).
- Costs: 0.07% a year.
- Result: 6.86% a year since 1998, 4.51% after inflation and costs, and 0.24 percentage points a year above its benchmark index (2026 half-year report). In the first half of 2026, the fund gained 9.4%.
Australia's Future Fund: a return target rather than a fixed allocation
The Future Fund, set up in 2006 to finance the pensions of Australian federal public servants, does not set an equity-bond split. Its mandate is a target: at least inflation plus 4% to 5% a year over the long term. It has achieved 8.3% a year since 2006, against a target of 7.0% over the period.
| Asset class, 30 June 2026 | Weight |
|---|---|
| Australian equities | 10.5% |
| Global equities, developed markets | 29.1% |
| Emerging market equities | 4.6% |
| Private equity | 12.1% |
| Property | 3.8% |
| Infrastructure and timberland | 11.5% |
| Credit | 8.1% |
| Alternative strategies | 14.9% |
| Cash | 5.4% |
Source: Future Fund, portfolio update at 30 June 2026.
This is the model furthest from an individual's portfolio: more than a quarter in unlisted assets and 15% in alternative strategies, sleeves that require a scale, teams and access to managers that are out of reach for an individual saver.
France's Pension Reserve Fund: the horizon drives the allocation
France's Pension Reserve Fund (FRR) illustrates the direct link between horizon and equity share. Since 2011, it has paid part of its reserves each year to Cades (France's social-security debt repayment fund): €2.1bn a year until 2024, then €1.45bn a year from 2025 to 2033 (Article L135-6 of the French Social Security Code). As long as its commitments were close, it had to keep a large share of hedging assets.
After the 2024 decision to extend its management horizon beyond 2033, the FRR revised its strategic allocation in June 2025 and raised the equity share to 50%, of which 46% unhedged, according to its 2025 annual report. At the end of 2025, its portfolio held 45.4% unhedged equities, 38.0% intermediate-risk assets and 16.5% hedging assets. It returned 9.06% in 2025 and 4.4% a year since 2010, 3.04 percentage points more than the average cost of French government debt.
What about university endowments?
The so-called "Yale model", popularised by the American university, goes even further into unlisted assets. According to its 2024-2025 financial report, around 91% of Yale's endowment is invested in assets expected to produce equity-like returns. The university returned 9.4% a year over ten years to the end of June 2025, according to Yale.
Six principles that carry over to an individual portfolio
| Principle | What sovereign wealth funds do | The equivalent for an individual |
|---|---|---|
| The horizon sets the share of growth assets | 80% equities for the NZ Super Fund, with no withdrawals before 2054; the FRR raises its equity share when its horizon lengthens | Split your savings by the date you will use them, and only invest in equities money you will not need for many years |
| A simple benchmark, written down in advance | Passive 80/20 reference portfolio; 70/30 index | Write down your own target allocation in two or three asset classes, for example a global equity index fund and government bonds |
| Rebalancing rules | A band of 68% to 72% equities for the Norwegian fund | Return to your target once a year, or when a weight drifts by more than a few points |
| Put a figure on the loss before it happens | -52.6% estimated by the NZ Super Fund in a repeat of 2008 | Calculate in euros what your portfolio would lose in a 2008-type crash, and check you could bear it without selling |
| Minimal costs | 0.07% a year for the Norwegian fund | Favour index funds and check the total fees of your accounts and wrappers |
| Do not copy what requires scale | Unlisted assets and alternative strategies reserved for funds with the teams and access to managers | The core of the model, global equities and government bonds, is accessible to every saver |
These principles describe a method, not an allocation to replicate: the right share of equities depends on each person's horizon, income, plans and ability to get through a crash. To see how equities, bonds and gold behaved during past crises, see our study of the crashes from 2000 to 2022; to understand why bonds do not always protect you, see our analysis of correlations between asset classes.
Sources
Official reports and pages consulted on 23 September 2026: NZ Super Fund, reference portfolio, performance, risk and volatility, 2025 annual report and press release of 16 September 2026; NBIM, benchmark index, strategy and 2026 half-year report; Future Fund; FRR, 2025 annual report. The asset-class groupings in the chart are Copio's.
This article is published for information and educational purposes. It does not constitute personalised investment advice. Past performance is not a reliable indicator of future performance.