Your net worth is everything you own minus everything you owe, and it is the one number that tells you whether your finances are moving forward. Income tells you what comes in and a budget tells you what goes out, but net worth shows what is left over the years. This guide explains how to calculate it, what to include and leave out, how households compare by age across Europe, and how to follow it without a spreadsheet.
Figures come from one fictional household used for illustration: a 27-year-old graduate renting alone in Utrecht, in the Netherlands, who takes home €3,100 net a month and sets aside €250 in savings and €200 in investments every month. The salary is anchored on official graduate data: Dutch higher professional education (HBO) graduates earn an average of €3,322 gross a month a year and a half after graduating, according to the HBO-Monitor 2025; our graduate, a few years in, earns €4,000 gross plus holiday pay. The screens are from the Copio app.
Key takeaways
- Net worth = assets - debts. It can be negative, and that is normal at some stages of life.
- Value assets at what you could realistically get for them today, not what you paid or hope to get.
- Leave out cars and pension rights you cannot access, and show your home separately if you own one.
- The trend matters more than the level. Check monthly, judge over a quarter or a year.
- Net worth growth mixes what you save and what your investments earn. Separate the two to understand it.
What net worth means
Net worth is a snapshot of your personal balance sheet on a given date. On one side are your assets: money in accounts, investments, property and anything else with a realistic value. On the other side are your debts: mortgages, consumer loans, overdrafts and outstanding card balances.
It is not the same as income. Someone on a high salary who spends it all and carries loans can have a lower net worth than someone on a modest salary who has saved steadily for ten years. That is why it is a useful complement to your savings rate: the savings rate measures the effort, net worth measures the accumulated result.
The formula
| Step | What to do |
|---|---|
| Every account and holding with a value you could access: current and savings accounts, brokerage and investment accounts, life insurance, property |
| Use today's balance or market value; for property, a conservative estimate rather than the asking price of the flat next door |
| Remaining mortgage capital, car or consumer loans, student loans, overdrafts, card balances |
| Net worth = total assets - total debts |
What to include and what to leave out
The hardest part is not the arithmetic, it is deciding what counts. A few conventions keep the figure honest:
- Main residence. If you own your home, include it at a cautious value and record the mortgage as a debt. Because a home is both a large asset and a place you live in, many people also show "net worth excluding home" to see their liquid progress.
- Cars. Usually excluded. They lose value every year and you rarely sell one to fund anything else. Official surveys do count them: the ECB's Household Finance and Consumption Survey includes vehicles and valuables in real assets (HFCS statistical tables, wave 2021). For a personal tracker, leaving them out gives a more conservative figure.
- Pensions. State and workplace pension rights are usually left out because you cannot withdraw them today. The HFCS takes the same line: it includes voluntary private pension plans and life insurance, but not public or occupational pension schemes (ECB, HFCS 2021 FAQ).
- Loans. Every loan counts as a debt at its remaining capital, including the small ones: a 0% instalment plan for a phone is still money you owe.
- Money owed to you. Count it only if you are confident it will come back.
A worked example
Here is our household's balance sheet in October 2026. As a renter with no loans, the calculation is short.
| Item | Type | Value |
|---|---|---|
| Current account | Liquid | €1,500 |
| Easy-access savings | Liquid | €6,000 |
| Brokerage account (index funds) | Invested | €6,500 |
| Total assets | Liquid + invested | €14,000 |
| Loans and card balances | Debt | €0 |
| Net worth | Assets - debts | €14,000 |
| Car, pension rights | Left out | Not counted |
A year earlier, the same household stood at €7,200. Net worth rose by €6,800, or 94.4%. The percentage looks spectacular only because the starting point was small. That growth has two sources. The monthly plan of €250 in savings and €200 in investments adds up to €5,400 a year if it held every month. The other €1,400 came from interest, market returns and extra saving, such as a share of the Dutch holiday pay paid in May. Early on, contributions do most of the work; as the invested part grows, returns take a larger share. The pay yourself first plan is what keeps the first part reliable.
How net worth compares by age across Europe
Benchmarks are tempting, but read them carefully: they are measured per household, not per person, and they include housing.
In the ECB's latest Household Finance and Consumption Survey, with 2021 as the main reference year, median net wealth in the euro area was €121,600 per household. For renters it was €12,000, against €265,800 for outright owners (HFCS statistical tables, wave 2021, table A3). Country medians ranged from €31,000 to €718,000 (ECB, HFCS 2021 FAQ).
Age changes the picture more than anything else. We extracted the medians by country and by age of the household's reference person from the same ECB table. You can download the data as a CSV file.
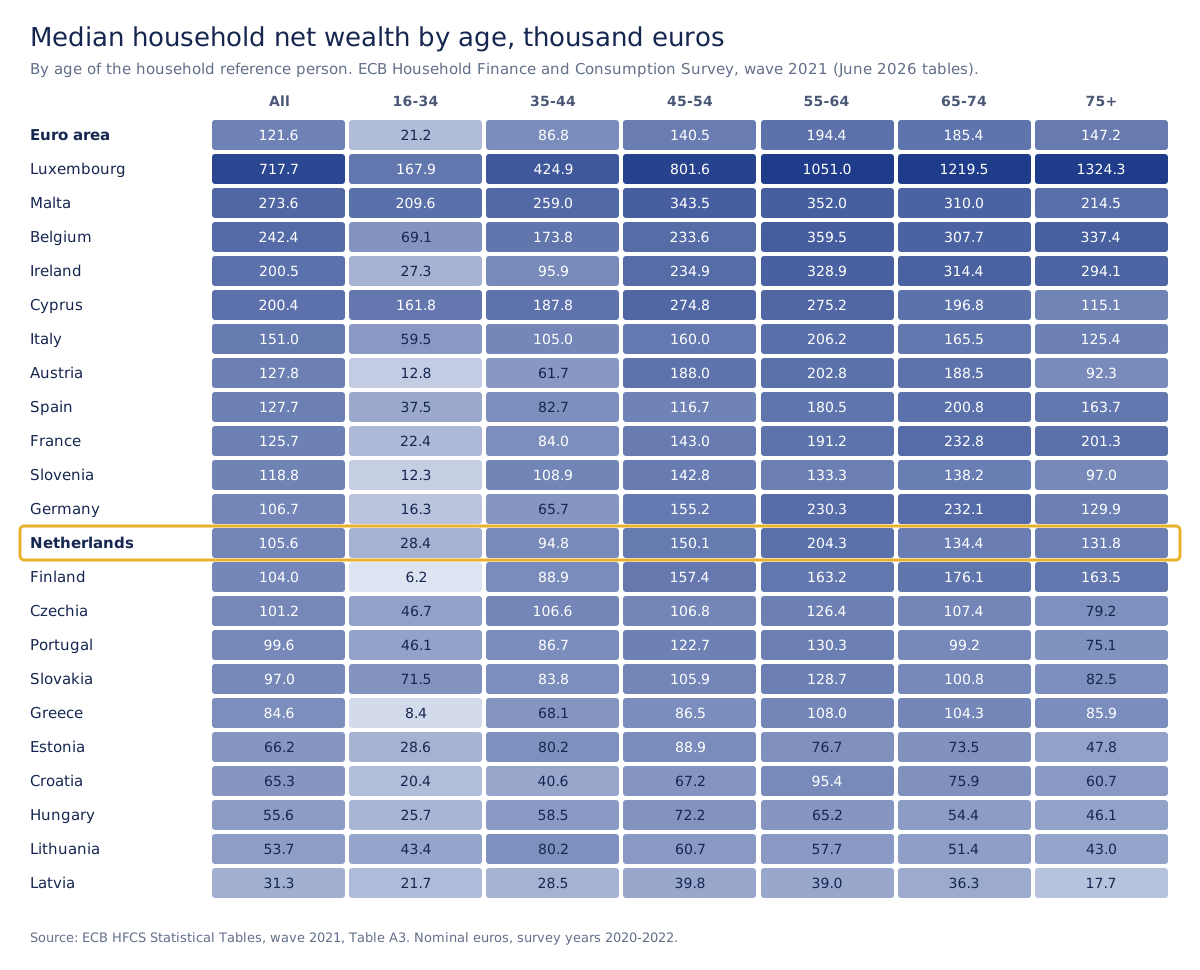
- Young households start low almost everywhere. The euro area median for households whose reference person is 16 to 34 is €21,200. The Netherlands is above it at €28,400, France close at €22,400, Germany below at €16,300.
- The big step comes between 16-34 and 35-44. The euro area median rises from €21,200 to €86,800, about four times more; in the Netherlands, from €28,400 to €94,800. Part of the step is housing: this is when many households buy a home and start building equity.
- Germany, Austria and Finland look low for the young (€16,300, €12,800 and €6,200): many young households rent, and the survey excludes public and occupational pensions, which understates countries where those pensions are a major form of saving.
- Italy, Spain and Belgium look higher (€59,500, €37,500 and €69,100), partly through home ownership and family wealth passed on to younger households.
- The Dutch overall median is below the euro area's (€105,600 against €121,600), for the same reason: Dutch occupational pension savings are left out of the figure.
On the national figures, Statistics Netherlands (CBS) puts the median net wealth of households whose main earner is 25 to 34 at €13,500 on 1 January 2024 (provisional), against €135,500 for all households. Our household's €14,000 is about half the HFCS median for Dutch under-35 households (€28,400), but close to the CBS median for its age group. Both are useful context, and neither is a target.
A few caveats apply to all of these figures: they describe households, not individuals; age is that of the household's reference person; values are nominal euros from surveys run between 2020 and 2022 depending on the country; public and occupational pensions are excluded; and samples for the youngest and oldest groups are small, so some cells carry wide margins of error.
The gap between owners and renters is mostly the home itself. A renter with €14,000 and an owner with €200,000 of equity are not comparable on liquidity: the renter can access almost all of it. That is why your own trend is a better benchmark than any national median.
How often to track it
Monthly is a good rhythm to look; a quarter or a year is a good rhythm to judge. A single month mixes market moves with irregular spending: a holiday, an annual insurance premium or a market dip can all pull the figure down for a few weeks. Our household's net worth fell slightly in April, with the markets, and again in July, the holiday month, while the year as a whole was clearly positive.
How to follow your net worth in Copio
- Connect your accounts. Copio aggregates your bank accounts, savings accounts, brokerage and investment accounts and life insurance contracts in read-only mode. It cannot move money.
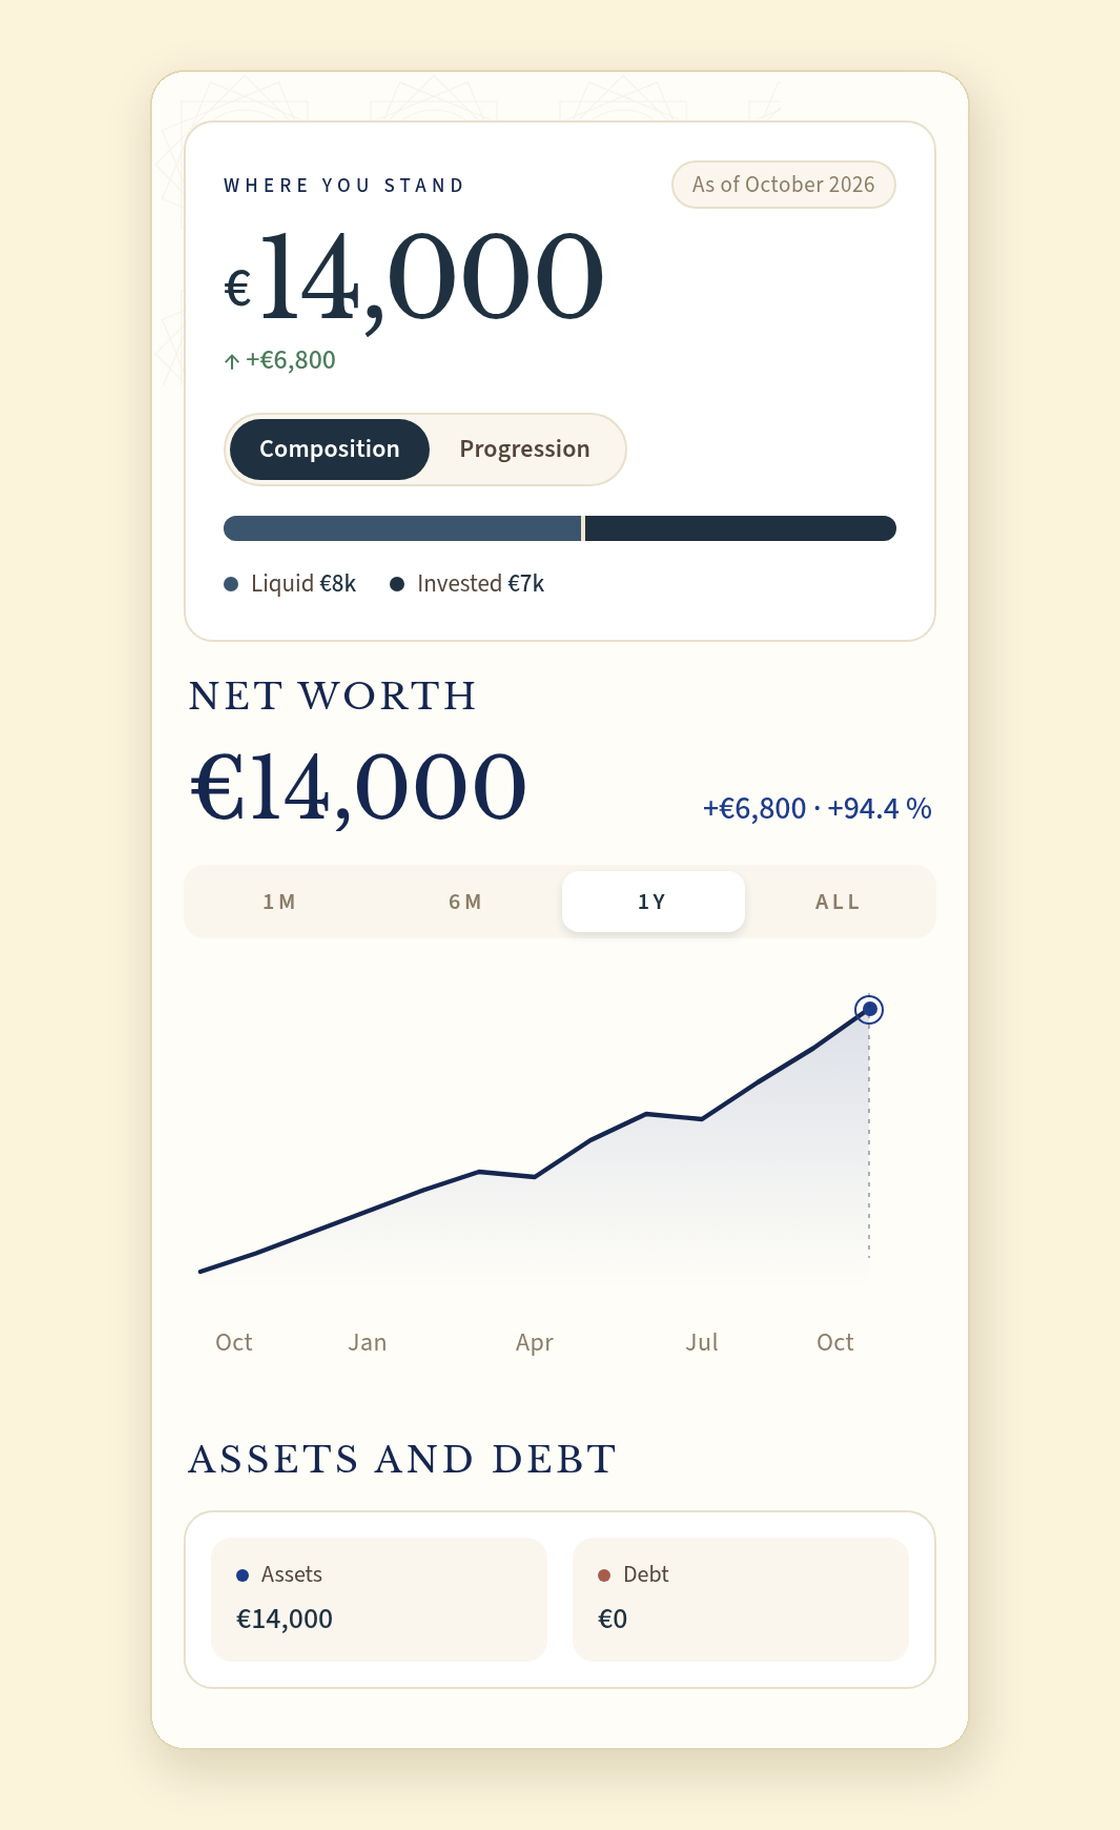
- Read "Where you stand". The top card shows your total net worth, assets minus debts, and how it changed over the period. The Composition view splits it between Liquid (cash and savings) and Invested money, and a Progression toggle sits next to it.
- Choose a period. The net worth card lets you switch between 1M, 6M, 1Y and All, with the change in euros and in percent and a chart.
- Check assets and debt. Below the chart, the Assets and debt summary shows both sides of the balance sheet. The debts shown are those held in the accounts you connect.
If you own a home, the figure is built from your connected accounts, so keep your own cautious estimate of the property and its value alongside it.
Common mistakes
- Using the purchase price for everything. A car bought for €25,000 is not worth €25,000 three years later, and a flat is worth what it would sell for, not what you paid.
- Forgetting small debts. Overdrafts, instalment plans and deferred card balances add up.
- Counting the same money twice. A transfer between two of your accounts is not new wealth.
- Reacting to one month. A dip after a holiday or a market correction says little on its own; look at the yearly line.
- Comparing yourself to the wrong median. National figures are per household and include property. Compare with your own figure from a year ago.
One number, followed over time
Net worth turns years of small decisions into one figure. Calculate it once with the method above, decide what you include, then keep the same rules every time you look. If you manage money with a partner, the same logic works for a shared figure, as explained in managing money as a couple.
Promotional note: Copio is the company publishing this article. The household and its figures are fictional and used for illustration only.