A savings rate is the share of your net income you set aside instead of spending, and a commonly cited target is somewhere between 10% and 20%. The number is simple, but how you calculate it changes the answer: which income, which period, and what counts as saving. This guide gives you the formula, a worked example in euros, the rules of thumb people use, how Europe's official household saving rates compare with yours, and how little of their income European households actually invest in shares and funds.
Figures come from one fictional household used for illustration: a 27-year-old graduate renting alone in Utrecht, in the Netherlands, who takes home €3,100 net a month and sets aside €250 for savings and €200 for investment each month. The salary is anchored on official graduate data: Dutch higher professional education (HBO) graduates earn an average of €3,322 gross a month a year and a half after graduating, according to the HBO-Monitor 2025; our graduate, a few years in, earns €4,000 gross plus holiday pay. The screens are from the Copio app.
Key takeaways
- Savings rate = (savings + investments) ÷ net income × 100.
- Measure it over six to twelve months. A single month is distorted by holidays, annual bills, holiday pay and bonuses.
- 10% to 20% is a common rule of thumb, not a standard. Consistency matters more than the exact figure.
- National household saving rates are a different measure and are not a benchmark for your personal rate.
- European households put only about 1.7% of their income into shares and funds directly (euro area, 2023-2025 average). A regular monthly investment already puts you well above that.
What a savings rate measures
Your personal savings rate answers one question: of the money that reached you, how much did you keep for later? "Kept for later" usually means money moved to a savings account, an emergency fund or an investment account. Paying off a credit card is not saving; it settles past spending.
It helps to split the rate in two. A savings rate covers cash you keep available, such as an emergency fund or money for a planned purchase. An investment rate covers money placed for the long term. Both are set-asides, but they do different jobs, and seeing them apart tells you whether your safety net or your long-term wealth is growing.
The formula
| Element | What to include | Example household |
|---|---|---|
| Net income | Take-home pay plus other regular income, for the same period | €3,100 a month |
| Savings | Transfers to savings accounts | €250 a month |
| Investments | Transfers to investment accounts | €200 a month |
| Savings rate | (Savings + investments) ÷ net income × 100 | 14.5% |
Split, that is a savings rate of 8.1% (€250 ÷ €3,100) and an investment rate of 6.5% (€200 ÷ €3,100). Use net income for a personal rate: it is the money you actually decide about. Some people use gross income, which gives a lower figure. Neither is wrong, but you should never switch between the two.
Worked example: why one month misleads
Take our household over a year. Most months, €450 leaves for savings and investment on payday. In July, the holiday month, suppose the savings transfer was cut to €150 while the €200 investment continued. In May, Dutch holiday pay (vakantiegeld), at least 8% of gross annual salary, adds about €1,850 net; suppose €600 of it went to savings.
| Period | Set aside | Net income | Rate |
|---|---|---|---|
| A typical month | €450 | €3,100 | 14.5% |
| July (holiday) | €350 | €3,100 | 11.3% |
| May (holiday pay) | €1,050 | €4,950 | 21.2% |
| Full 12 months | €5,900 | €39,050 | 15.1% |
Look only at July and you would think the plan is failing. Look only at May and you would feel richer than you are. The 12-month figure is the honest one. A practical rhythm: check the rate monthly to catch drift, and judge it over a rolling six or twelve months.
The best way to protect the yearly figure is to decide the amounts at the start of the month, not at the end. That is the logic of paying yourself first, and of setting aside a monthly provision for the holiday so July does not eat into savings.
What is a good savings rate?
There is no official "good" rate, but a few rules of thumb are widely used:
- 10% as a starting point. Often suggested as a first target when you are building the habit.
- 20% with the 50/30/20 rule. The rule splits net income into roughly 50% needs, 30% wants and 20% savings and debt repayment. Our household's €450 is 14.5% of €3,100: above the starting point and below the 50/30/20 level, which is understandable when rent takes more than a third of take-home pay, as it does for our Utrecht household (€1,100 of €3,100).
- Higher for early or ambitious goals. People aiming to stop working early often target far higher rates, which usually requires a high income or very low housing costs.
Treat these as rules of thumb, not advice. Rent, debts, dependants and income level all change what is realistic. A rate that is a little lower but held every month will usually do more than an ambitious one that collapses in the first expensive month.
How your rate compares with Europe's household saving rates
You will often see national saving rates quoted as a benchmark. They measure something else. Eurostat's household saving rate is gross saving divided by gross disposable income, taken from national accounts. It counts everything households do not spend on consumption, including buying and renovating homes. In the euro area, the rate was 14.2% in the second quarter of 2026, and the same release puts household investment, which "mainly consists of the purchase and renovation of dwellings", at 8.3% of income.
Rates also differ widely by country. Annual gross household saving rates for 2024 from Eurostat's household saving rate table:
| Country | Gross household saving rate, 2024 |
|---|---|
| Germany | 19.6% |
| France | 17.9% |
| Netherlands | 16.7% |
| European Union | 14.5% |
| Spain | 12.8% |
| Italy | 11.1% |
| Poland | 7.8% |
These figures describe whole economies, not a typical household, and they include housing investment and a broader definition of income. Use them as context for how saving habits vary across Europe, not as a target for your own rate.
How much European households invest
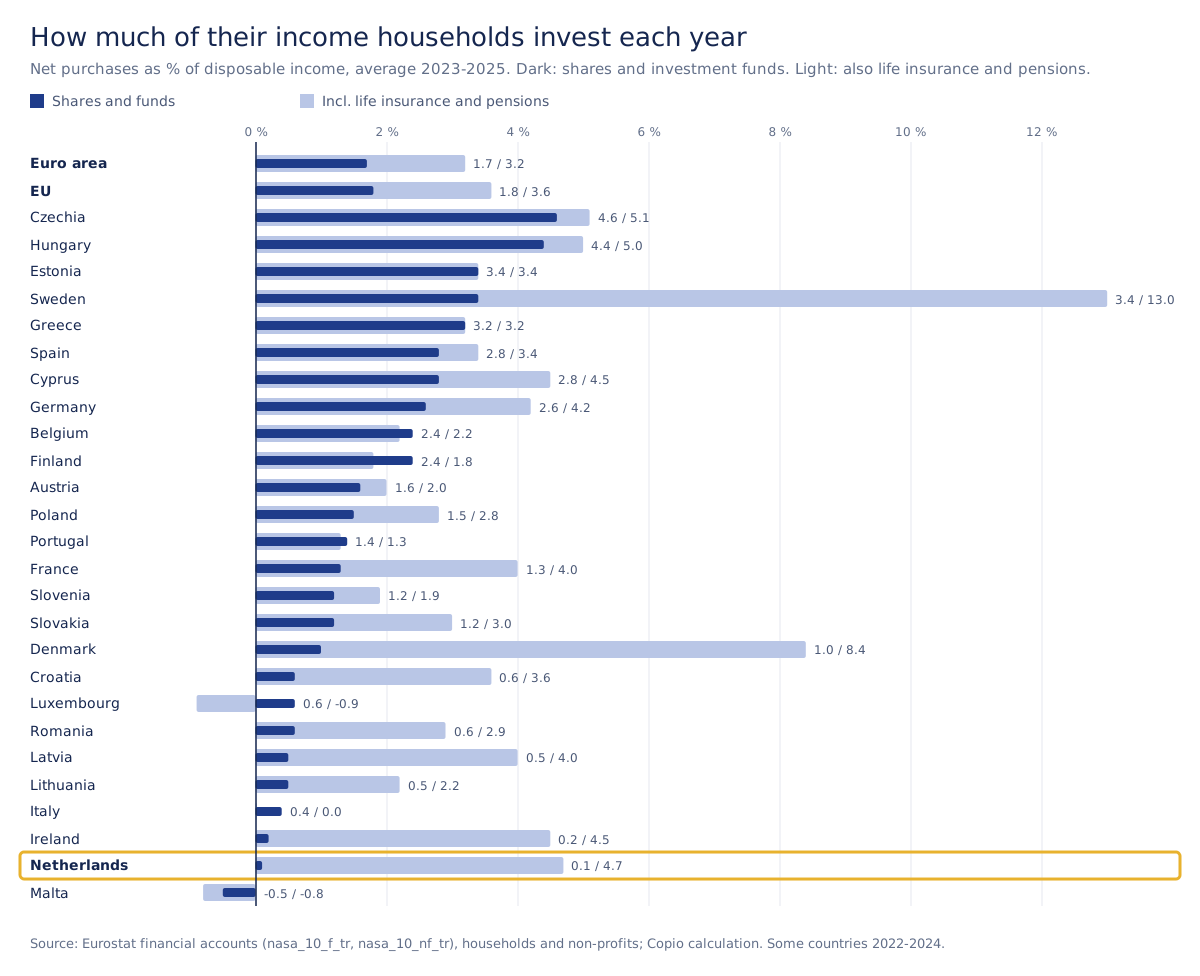
Saving is not the same as investing, and Europe's national accounts show the difference. The clearest measure of how much households invest in the markets is their net purchases of listed shares and investment funds as a percentage of disposable income: what they buy, minus what they sell. Averaged over 2023-2025, it was 1.7% in the euro area and 1.8% in the EU, according to Eurostat financial accounts (nasa_10_f_tr, nasa_10_nf_tr), Copio calculation. A broader measure that also counts life insurance and pension savings roughly doubles the figure.
| Area | Shares and funds, % of income (2023-2025 average) | Including life insurance and pensions |
|---|---|---|
| Euro area | 1.7% | 3.2% |
| Germany | 2.6% | 4.2% |
| France | 1.3% | 4.0% |
| Netherlands | 0.1% | 4.7% |
Set that against the other numbers and the gap is striking. Euro area households save around 14-15% of their income, and they put about 8.5% of it into housing: Eurostat's household investment rate, mostly the purchase and renovation of homes, was 8.46% in the euro area in 2025. Only about 1.7% goes directly into shares and funds.
You can download the data as a CSV file.
Few households hold these assets directly either. In the ECB's Household Finance and Consumption Survey (wave 2021, table C1), 10.8% of euro area households held listed shares and 12.5% held mutual funds. In the Netherlands the figures were 6.1% and 15.6%, in Germany 15.4% and 20.6%, and in France 12.1% and 8.7%. The two cannot be added, because many households hold both.
Two caveats. These are net flows across all households, so purchases by younger savers are offset by sales from retirees drawing on their portfolios, and a household that invests regularly puts in far more than the average suggests. And investing through a wrapper is outside the narrow measure: French unit-linked life insurance and Dutch pension funds invest in markets on households' behalf. That is why the Netherlands is at 0.1% on the narrow measure but 4.7% once life insurance and pensions are included. The 2025 figures are provisional.
Our Utrecht household invests €200 a month, 6.5% of its net income, on top of the workplace pension deducted from its salary. The comparison is not like-for-like, because the national figure is net of sales, but a regular monthly investment already puts the household well above the average flow into shares and funds, in the Netherlands and in Europe. The next question is what one more point would do.
Turn a higher savings rate into a higher investment rate
Copio's angle on the savings rate is this: once your emergency fund is in place, an extra point of savings rate does more work as an extra point of investment rate. Money in a savings account is there to be safe and available, and that has a price: its interest barely keeps up with inflation, so its purchasing power hardly grows. Money invested for decades in a diversified growth portfolio can compound, with falls along the way.
Take our household. At 27, it invests €200 a month, 6.5% of its income. One extra point means €31 a month more (1% of €3,100), the step from 6% to the 7% target you will see on its savings card below. In the central scenario of the simulator, €31 a month invested from 27 to 65 (456 months) at about 4.3% a year after inflation grows to roughly €35,000 in today's euros, from €14,136 paid in. Start the same €31 at 37 instead and the result is about €19,900, from €10,416 paid in. Waiting ten years costs about €15,100, more than 40% of the end value, for only €3,720 less contributed. The simulator below opens on these figures; move the sliders to try your own.
Simulator: invest one more point of your income
Move the sliders to see what an extra share of your net income, invested every month from a given age, could be worth at 65. Figures are in today's euros (after inflation).
€31 a month · Total you put in: €14,136
Value at 65, in today's euros, by scenario
Start at 37 instead and the central result falls to €19,894 (43% less).
Start at 27 Start at 37Age
Assumptions: a diversified growth portfolio based on Copio's published capital market assumption for global equities (6.4% a year, nominal, in euros), minus 2% inflation, so about 4.3% a year after inflation in the central case. The unfavourable and favourable cases use 3 points less and 2 points more. Contributions stay constant in today's euros; fees and taxes are not deducted.
Illustration only, not a forecast or personal advice. Investing involves risk, including the loss of capital, and returns can be negative for long periods.
How the simulator works: the central scenario starts from Copio's published capital market assumption for global equities, 6.4% a year nominal in euros, and subtracts 2% inflation, which gives about 4.3% a year after inflation. The unfavourable scenario uses 3 points less and the favourable one 2 points more. Contributions stay constant in today's euros, and fees and taxes are not deducted, so actual results would be lower.
The kind of portfolio Copio's strategist builds is exposed to growth, with diversified global equities as its core, and adds downside protection designed to limit deep losses in a crash. Protection reduces risk; it does not remove it, and it has a cost. How put options can protect a portfolio from a crash, and what that costs. This describes Copio's approach, not a recommendation for your situation.
Risk warning: the simulator and the figures above are an illustration, not a forecast and not personal advice. Investing puts your capital at risk, markets can fall sharply, and returns can stay negative for long periods. Keep your emergency savings in place first, and only invest money you will not need for many years.
How to track your savings rate in Copio
Copio calculates the rate for you from your connected accounts. There is no manual entry: accounts are aggregated read-only, and the app recognises transfers to savings and investment accounts as set-asides. Transfers between your own accounts are not counted as spending.
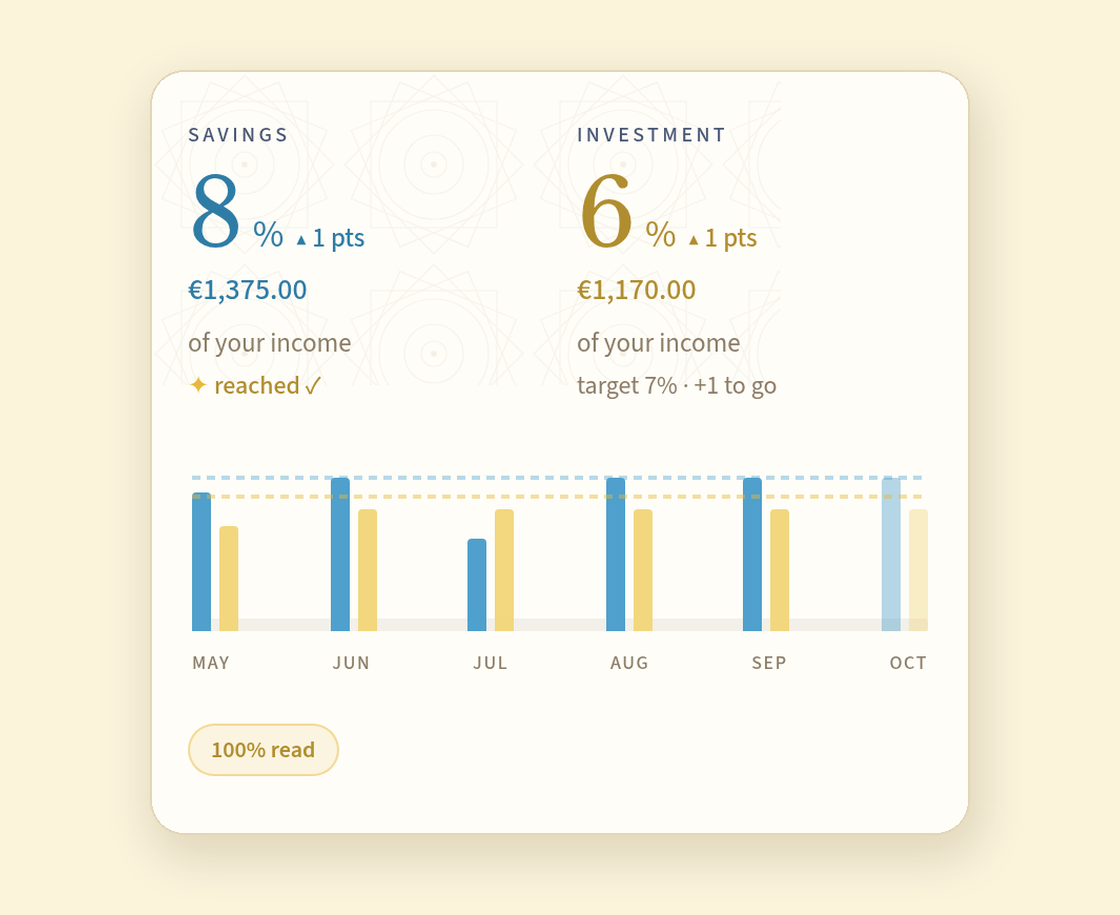
With no month selected, the amounts are totals over the months on the chart: €1,375 saved and €1,170 invested across six months, July's holiday included. Tap a month's bars to see that month on its own.
- Read the two rates. The view shows a savings rate and an investment rate as shares of your income, each with the amount behind it and the change in points versus the previous period. Our household is at 8% savings and 6% investment, both "▲ 1 pts".
- Set a target for each. Targets are optional and you can edit them. When a rate is at or above its target, the card says "reached ✓". Otherwise it shows the target and what is left: our household's investment card reads "target 7% · +1 to go", the extra point discussed above.
- Look at the months, not just the latest. The monthly bar chart shows both rates against dashed target lines. July dips because of the holiday. The current month is drawn lighter because it is not finished yet.
- Check the coverage pill. "100% read" means all of the period's transactions have been read and categorised. If coverage is lower, the rate may still move.
- Act in the plan. The savings view tells you where you stand. The monthly plan is where you decide the amounts for next month, before the spending starts.
Common mistakes
- Judging from one month. Holidays, annual insurance and bonuses swing a single month by several points. Use six to twelve months.
- Counting internal transfers as saving. Moving money from savings back to your current account and out again is not new saving. Count net set-asides.
- Changing the definition. Gross one month, net the next, or pension contributions included only sometimes: pick one definition and keep it.
- Comparing with the national rate. A national household saving rate includes housing investment and is calculated on a different income measure.
- Chasing a number you cannot hold. A target that forces you to dip into savings every few months produces a lower real rate than a modest one you keep.
Where to go next
If your rate is lower than you want, the fix is usually in the order of your budget, not in willpower. Start with the monthly plan where saving comes first, then choose how to manage the rest with envelopes or a flex budget. To see what your savings add up to over time, read how to calculate your net worth. For the month that most often breaks a savings rate, see the holiday and Christmas budget plan.
Promotional note: Copio is the company publishing this article. The household and its figures are fictional and used for illustration only.