Executive summary
Nomad reported 18.4% annualised after fees from 10 September 2001 to 31 December 2013, versus 6.5% for MSCI World net in US dollars. Sleep and Qais Zakaria achieved exceptional compounding through concentrated business ownership. They also lost 45.3% before fees in 2008, worse than the index's 40.7% decline. The final letter labels its returns unaudited and its net result specific to an inception investor.
Copio's assessment: the realised growth compensated for substantial equity risk over this history, but the portfolio was neither demonstrably growth-optimal nor protected against crashes. Its annual before-fee Sharpe and Sortino exceeded the index's over 2002-2013; its annual-return correlation with the index was 0.90. Those results support successful stock selection, rather than a claim of independent return sources or a repeatable optimum.
What was in the fund?
Nomad was a concentrated partnership investing in individual companies, rather than a fixed allocation among broad asset classes. The December 2006 letter, page 106, described it as close to fully invested: five holdings represented half the capital and the top ten around three quarters. A tail of roughly twenty positions included country baskets, distressed turnarounds and smaller legacy investments.
December 2006: top five holdings approximately 50%; top ten approximately 75%; close to fully invested. Source: Nomad letter, page 106; concentration data (CSV). The top ten include the top five; these are approximate, overlapping groups.
The December 2006 letter names Costco, Dell, Amazon and Berkshire Hathaway as the companies that had come to dominate the portfolio (page 105), without giving their weights. The December 2008 letter, page 151 returns to Amazon and Costco as examples of the managers' business thesis. The letters do not include a complete December 2013 allocation; partners received the full schedule of investments separately (page 223).
The postamble confirms liquidation after the final letter. This article assesses the historical partnership, not the managers' current personal portfolios or an allocation available to copy today.
Why did the investors use this structure?
Sleep and Zakaria wanted to own businesses whose economics could improve over many years. Their Spring 2021 preamble describes an evolution from buying inexpensive businesses to near-permanent holdings. The rationale for concentration was to allocate substantial capital to the opportunities they understood and valued most, with patience for business investment to pay off. It was not a strategy intended to track a broad equity index.
Their scale-economics-shared thesis linked growth to giving customers the savings from greater scale through lower prices. More purchases could then create further savings. The 2008 letter discusses Amazon and Costco in that context. The mechanism explains their willingness to hold selected businesses; it does not establish that any purchase price or concentration would maximise investor wealth.
The final letter's risk disclosure, page 223, explicitly acknowledges permanent impairment, greater volatility from concentration and unsuitability for investors with horizons shorter than five years. Its fee discussion, page 218, explains that refundable performance fees and a time-dependent hurdle produced different net outcomes by subscription date. Those terms made patient capital and investor-specific costs part of the structure.
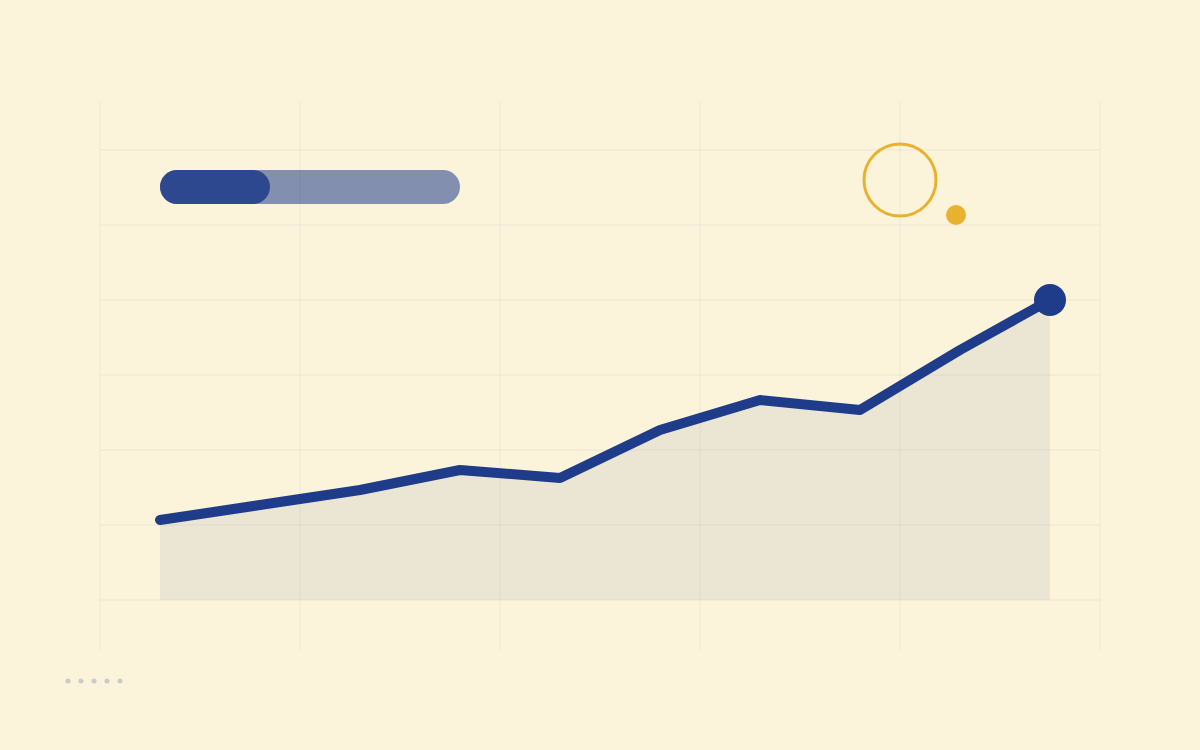
The full-period reported result is 20.8% annualised before performance fees and 18.4% after fees, versus MSCI World's 6.5%, from September 2001 to December 2013. For comparable Sharpe and Sortino calculations, we use the twelve complete calendar years 2002-2013 from the annual table, page 219. That table supplies Nomad before fees and MSCI World net USD returns; it does not supply annual net investor returns.
2002-2013, rounded annual inputs: $100 becomes $921.15 at Nomad before fees versus $209.47 at MSCI World net USD. Source: Nomad December 2013 letter, page 219; annual returns, cash and wealth (CSV). Our reconstruction from rounded annual returns differs slightly from the letter's cumulative table.
| Measure, 2002-2013 | Nomad before fees | MSCI World net USD |
|---|
| Geometric annual return | 20.33% | 6.36% |
| Sharpe, annual observations | 0.66 | 0.33 |
| Sortino, annual observations | 1.75 | 0.52 |
| Annual total-return standard deviation | 35.96% | 21.45% |
| Worst calendar year | -45.3% (2008) | -40.7% (2008) |
Nomad delivered much higher growth with higher measured risk, and its return advantage also survived these annual risk-ratio comparisons before fees. Cash is Kenneth French's monthly one-month Treasury-bill series compounded by calendar year. These twelve-observation ratios use the same frequency and cash target for both sides. They cannot be attached to the separate 18.4% after-fee inception result or compared directly with ratios calculated from monthly returns.
Nomad before fees: CAGR 20.33%, Sharpe 0.66, Sortino 1.75; MSCI World: 6.36%, 0.33, 0.52. Sources: Nomad annual table and Kenneth French cash series; World/cash frontier data (CSV). The plot uses mean annual return and sample standard deviation of annual excess returns.
The frontier includes only long-only World/cash mixes rebalanced annually, with no leverage or implementation costs. Nomad is an external comparison point with more measured risk than any mix on that curve. It is not the frontier for Nomad's individual-stock opportunity set, nor a proof that concentration maximised expected geometric growth. Nomad fees would reduce its investor returns; the complete annual net series needed to calculate net risk ratios is absent.
Copio's reading
Was it optimal for geometric growth?
Nomad's concentrated selections produced substantially more wealth than the broad index over this record, but optimality is unproven. The reported after-fee inception CAGR and the twelve-year before-fee comparisons both support strong realised compounding. They do not establish the expected returns and joint-loss probabilities of alternative concentrations available at the time. Our Buffett study examines the related difference between understanding selected businesses and reproducing an investor's whole structure.
The relevant objective is expected log wealth after costs over a common horizon, subject to the same liquidity and withdrawal requirements. Reducing concentration would help only if avoided losses outweighed growth forgone; protection would help only after its premiums, financing and trading costs. Nomad's subscription-dependent fees also change that comparison. The record demonstrates a successful outcome, without establishing that an untested alternative or the actual portfolio was optimal.
Was it crash aware and protected?
Nomad acknowledged loss risk, but its 2008 result shows no effective protection against that equity crash. It lost 45.3% before fees, versus the index's 40.7%. The following year's 71.5% rebound still left capital 6.2% below end-2007; recovery required 82.8%. The two returns averaged +13.1% arithmetically but compounded at -3.1% a year. Business quality and patience did not prevent a severe loss.
The 2008 letter, page 149, argues for slack and a cash buffer. That is evidence of the managers' reasoning, rather than proof that the fund carried protection capable of meeting every investor's cash needs. A forced withdrawal would leave less capital for recovery. Annual observations cannot identify the worst intra-year loss or exact recovery date; our crash-withdrawal analysis examines that separate cash-flow problem.
Was it diversified without giving up growth?
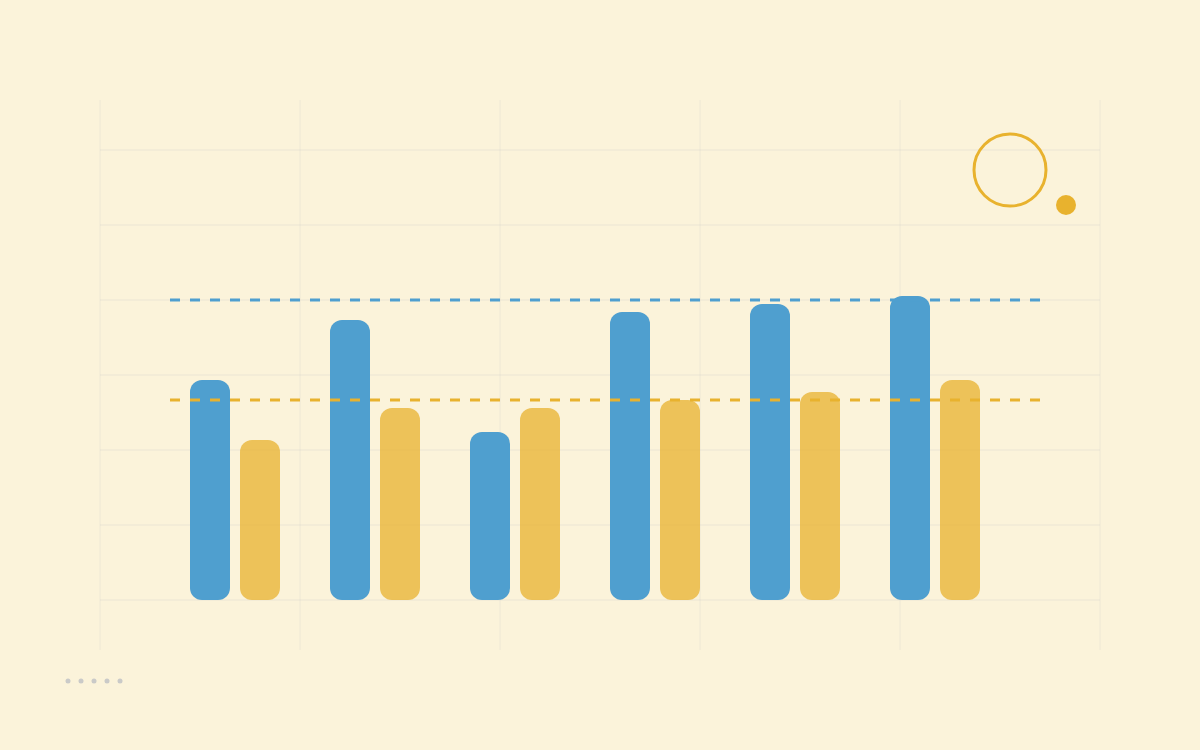
Growth was strong; broad diversification was not its defining feature. The top-five concentration and 45.3% crisis loss show the cost of relying on a small set of equity investments. Across 2002-2013, the correlation of Nomad's annual returns with MSCI World was 0.90. Its stock selection added substantial realised return, while the fund remained closely exposed to the direction of global equity markets.
2002-2013 annual-return correlation: Nomad before fees / MSCI World net USD = 0.90. Source: Nomad annual table, page 219; fund/index correlation matrix (CSV). This is a whole-fund comparison, not a constituent or crisis correlation matrix.
The public letters do not supply the complete dated holding weights and return histories needed for an internal correlation matrix. We therefore cannot measure how much each company diversified the others or attribute the entire return advantage to concentration. This successful selected record also excludes the experience of managers whose concentrated strategies failed. Our Lynch study adds the distinction between fund returns and the investor's experience of contributions and withdrawals.
Copio does not assign a replica grade: broad UCITS ETFs would not faithfully reproduce Nomad's individual-company selection. The evidence supports successful growth with substantial shared equity and liquidity risk. It does not support presenting this historical partnership as a crash-protected portfolio or as a diversified template for a household.
FAQ
What return did Nick Sleep's Nomad partnership achieve?
The December 2013 letter reports 18.4% annualised after performance fees from 10 September 2001 to 31 December 2013, versus 20.8% before performance fees and 6.5% for its MSCI World net USD index comparator. The figures are unaudited. The after-fee result describes an inception investor; subscription dates affected each partner's fee experience. These are nominal US dollar results, before personal taxes.
Did Nomad avoid the 2008 crash?
No. Nomad reported a 45.3% calendar-year loss before fees in 2008, against 40.7% for its MSCI World net USD comparator. Its 71.5% pre-fee rebound in 2009 still left the balance 6.2% below end-2007. Annual observations cannot establish the maximum drawdown or exact recovery date.
What did scale economics shared mean at Nomad?
Sleep and Qais Zakaria described businesses passing savings from greater scale to customers through lower prices. More purchases could then create further savings. The letters discuss Costco and Amazon as examples. That business mechanism does not guarantee a favourable share purchase price, future returns or protection in a market crash.
Is Nomad still an investment partnership you can copy?
The managers' Spring 2021 postamble says the portfolio was liquidated and money returned a few months after the December 2013 letter. This article studies that historical partnership, not their current personal portfolios. A broad equity ETF would not faithfully reproduce its concentrated selection of individual companies, so copio does not assign it a replica grade.
Was Nomad optimal for geometric wealth growth?
Its reported 18.4% annualised after-fee result establishes strong historical compounding, but not an optimum. That would require comparing feasible portfolios using expected log wealth after costs, over the same horizon and with the same liquidity constraints. Nomad's 2008-09 returns averaged 13.1% before fees yet compounded at minus 3.1% a year. The letters do not establish whether a different concentration or costed protection would improve future geometric growth.