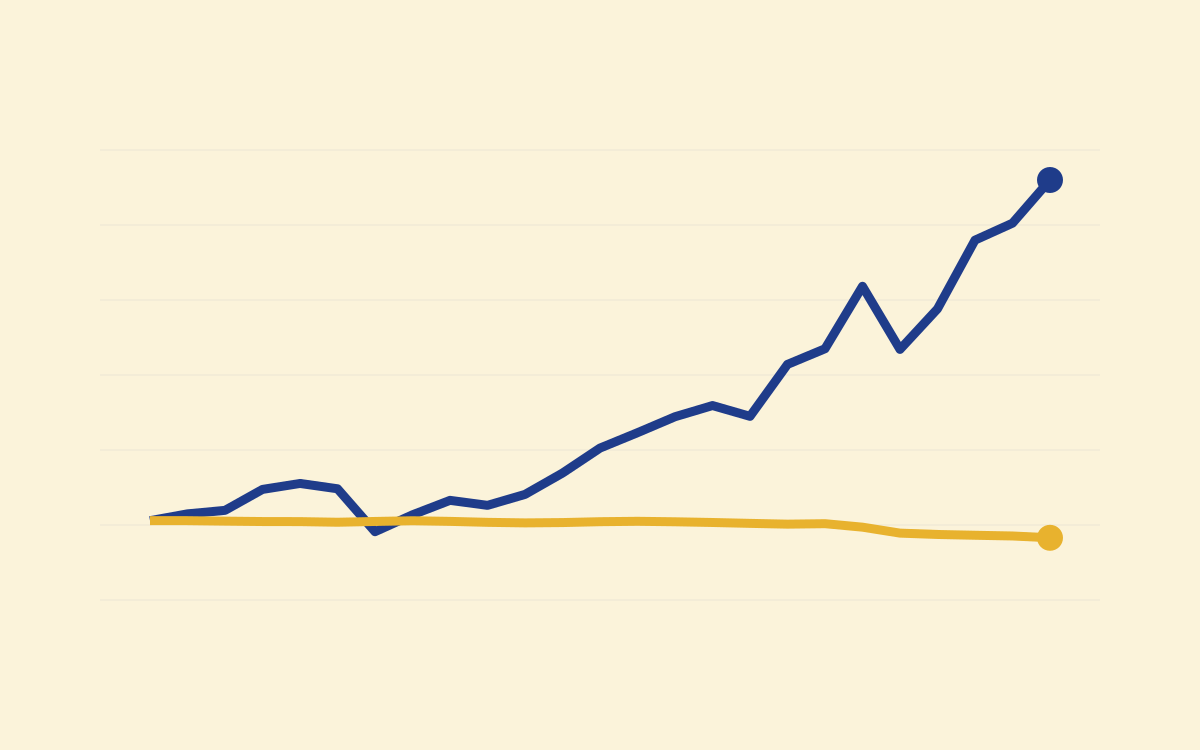
From January 2003 to September 2026, €100 following average euro area deposit rates ended with €78.40 of purchasing power. The same starting amount following the MSCI World net equity index in euros ended at about €529, after the same inflation adjustment. Both examples begin with money already saved. Where that money was held led to very different long-term outcomes.
Saving creates the money available to accumulate; the asset holding it determines the returns and risks that follow. A rising cash balance can still buy less over time. Equities can grow faster than prices, but their value can fall sharply along the way. The case for prioritising long-term private investing therefore has two parts: exposure to potential growth and a plan for the losses that can interrupt it.
Key takeaways
Give long-term capital an explicit role. The average deposit balance rose to €131.00 while prices rose 67.1%, leaving less purchasing power.
Read the growth rate beside the drawdown. The equity example compounded at 7.3% a year after inflation but suffered a 50.4% peak-to-trough fall, measured at month end.
Separate spending money from risk capital. A strong final balance does not help someone forced to withdraw during a deep loss.
A rising balance, falling purchasing power
The deposit calculation weights overnight, term and notice-deposit rates by the amount households held in each category each month. It represents the changing average deposit mix, not one account or a strategy a saver could have followed unchanged.
The largest recent losses came in 2021 and 2022, when the estimated real deposit returns were -4.49% and -8.15%. In 2023 the nominal deposit return rose to 0.80%, but December-to-December inflation of 2.93% still left a real loss of 2.07%. A higher interest rate does not by itself mean a positive inflation-adjusted return.
The equity line shows a different risk exposure. MSCI World’s net total return in euros, deflated by the same price index, turned €100 into about €529 over the period. Starting at end-2000 instead, before the final two years of the dot-com decline, gives about €302 by September 2026. Start dates matter; year-end observations also hide losses within each year. An equity index is not a substitute for a deposit with the same risk or access terms.
Saving more and earning a return do different jobs
The €100 comparison adds no further contributions. Its divergence comes from the returns earned on the original balance, including reinvested income, and their interaction with inflation. In a household account, new saving would add another source of growth.
The monthly-contribution study isolates that second effect. From January 2003 to September 2026, hypothetical month-end contributions of €100 in constant purchasing power totalled €28,500 and ended at about €87,300 in the same global equity index. Doubling the contribution doubled both the money paid in and the final balance. Those amounts are in September 2026 euros; the lump-sum chart uses December 2002 prices.
These examples show how contributions and investment returns combine to build financial assets. They do not establish a future return, a suitable contribution or a complete net-worth outcome: debts and other assets are outside the calculation.
Cash serves a different time horizon
Money available for bills or near-term spending has a different purpose from money exposed to decades of market returns. Stable nominal value and access have uses that an equity return chart does not price. The deposit result shows the purchasing-power cost of holding this average cash mix over a long period; it does not show that all cash was unnecessary.
A higher short-term rate also did not remove the long-run inflation gap in this sample. Approximately compounding EONIA and then the euro short-term rate turned €100 into €131.40 before inflation, or €78.60 after inflation. That is close to the deposit result, although the paths differed. The benchmark is an interest-rate series, not an available fund return.
National averages differ
French deposits grew 45.9% before inflation, against a 57.6% rise in French consumer prices. Spanish deposits grew 24.1%, against a 72.8% rise in prices. These differences combine national deposit mixes, interest rates and inflation. The data does not isolate the contribution of any one product or bank.
Growth through a 50% drawdown
The equity example’s 7.3% annualised real growth is its geometric growth rate: the constant annual rate that links the starting and ending purchasing power. It includes the effect of losses and recoveries, before investor taxes and fund fees. It is not an arithmetic average of annual returns or a forecast.
The same monthly series fell 50.4% in purchasing power from May 2007 to February 2009. It first regained that May 2007 level in October 2013, more than six years after the peak. These are month-end observations; they do not capture every loss within a month.
A fixed initial holding reached the endpoint shown because the calculation made no withdrawals along the way. Selling units to fund spending during the fall would have left fewer units participating in the later recovery. That is why crash risk belongs beside the long-run return when assessing private investment capital.
For a practical review, identify which money has a near-term spending date, then examine the drawdown and recovery assumptions for the capital intended to remain invested. Compare costs and inflation on the same basis as returns. The objective is sustained compounded wealth; neither the highest past return nor the lowest volatility alone establishes the best allocation.
ECB deposit rates and deposit stocks are compounded monthly as annual rate divided by twelve. The notice-deposit rate covers notice up to three months, weighted by all notice deposits. Eurostat HICP supplies local inflation; the common comparison ends in September 2026. September 2026 deposit rates for the euro area, Germany, France, Italy and Spain are provisional. MSCI’s net index deducts modelled dividend withholding taxes, but not fund fees or an investor’s own taxes. The deposit and money-market calculations exclude taxes and fees.
Data checked on 29 October 2026 and extended to September 2026 on 3 November 2026.
Published by copio for information and education, without a recommendation to hold or move money into any asset. Past performance does not predict future returns; investments can lose value.
FAQ
Did every savings account lose purchasing power?
No. The calculation follows a changing, stock-weighted average of household deposits, including current accounts. Individual accounts, tax treatments and deposit choices differ. It is not the return on a specific account held throughout the period.
Is the money-market line a fund return?
No. It approximately compounds monthly average EONIA and euro short-term rates. It excludes fund fees, trading costs and investor taxes, and does not reproduce a particular fund.