A US 60/40 portfolio lost 23.4% of its purchasing power between January 1966 and September 1981. Its dollar value rose, but prices rose faster. The lesson from the inflation era is to measure what a portfolio can buy, and how long an investor might have to wait for that purchasing power to recover.
A dollar invested, after inflation
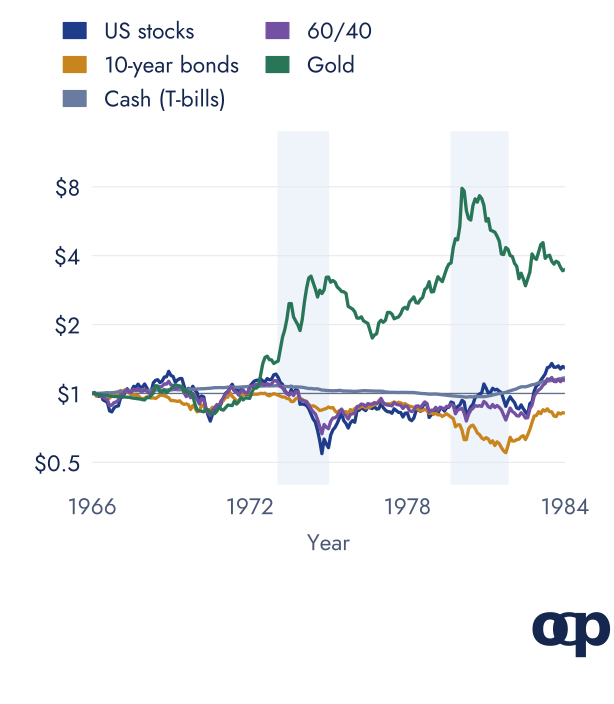
Copio calculation for January 1966 to December 1983, in US dollars after US CPI, with dividends and bond income reinvested (monthly inputs; period returns). The logarithmic scale gives equal space to equal percentage changes. The chart continues beyond the September 1981 yield peak to show the subsequent reversal.
By that peak, US consumer prices had risen 192% since the start of 1966. Stocks had lost 12.1% after inflation, 10-year Treasuries 44.9%, and three-month bills had roughly broken even (+1.1%). Gold had gained 334%, although its price was fixed at $35 until 1968 and the return was far from smooth.
Why shares and bonds fell together
An inflation shock can hit both sides of a conventional portfolio. Higher yields reduce the price of existing bonds; higher costs and discount rates can hurt shares. As AQR's research explains, inflation shocks tend to move stocks and bonds in the same direction, while growth shocks can move them in opposite directions.
The oil shocks of 1973-74 and 1978-79 intensified the pressure. Paul Volcker's Fed eventually accepted a deep economic slowdown to bring inflation down. The US 10-year yield closed at 15.84% on 30 September 1981 (FRED).
Recovery was a long, uneven journey
A 60/40 investor starting in November 1968 briefly regained that purchasing power in late 1972. After the next crash, the portfolio was 41.0% below the starting level by September 1974. It next recovered in April 1983, and remained above that reference level from August 1984 through the remaining sample.
This was not one uninterrupted 14-year drawdown. It was a long period with brief recoveries and renewed losses, difficult for anyone who needed to withdraw money along the way.
The inflation winners had their own crashes
Gold lost 62.5% of its real value from its January 1980 monthly-average peak to June 1982. On the same measure, it did not regain the peak's purchasing power until February 2025. Energy prices also reversed sharply after their surge. These are spot-price histories; holding a commodity fund would produce different returns.
The experience was not uniform across countries either. UK retail-price inflation reached 26.9% in August 1975 (ONS). Local inflation and currencies matter when applying US evidence to a European portfolio.
Three practical questions
- What is my return after inflation? A rising account balance can hide a loss of purchasing power.
- Could I wait through a long recovery? Money needed soon has a different job from retirement savings.
- What happens if the hedge crashes too? Gold's gains came with severe reversals; long bonds also have substantial duration risk.
The Sharpe ratio explainer shows how to compare portfolios without judging them on returns alone. The series framework turns that uncertainty into portfolio questions rather than a forecast of another 1970s.
Sources and data
Copio calculations compound monthly returns from December 1965 and deflate by US CPI. Stocks and bills use the Kenneth French Data Library and FRED; gold uses World Bank monthly averages. Ten-year Treasuries are modelled from yields and rolled monthly; 60/40 rebalances monthly without fees or taxes. Drawdowns use month-end real wealth, so intra-month lows are excluded. Gold's monthly-average prices smooth returns. One US episode cannot establish how another country's portfolio will behave, and the chart's 1983 endpoint differs from the September 1981 comparison in the text.
Data checked on 15 October 2026.
- real returns 1966-1981, sub-periods and real drawdowns (CSV)
- monthly historical inputs and returns (CSV)
This article is for information and education, not personalised investment advice. Past performance is not a reliable indicator of future performance.