A resilient portfolio needs investments that respond differently to growth, inflation and higher rates. Owning more funds helps little if they all depend on the same companies or the same economic conditions. The starting point is to understand what each holding contributes, then set rules for how much risk to take.
What happened when rates rose
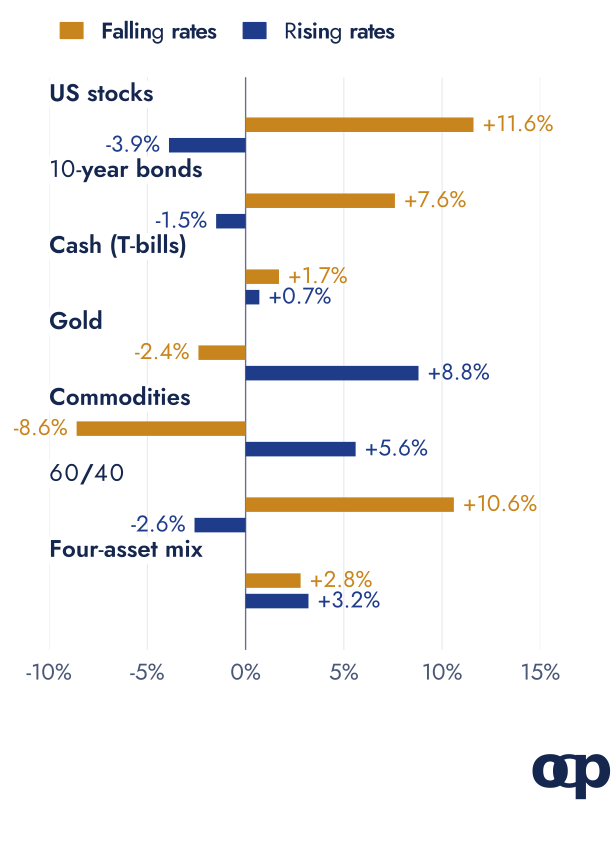
In copio's analysis of 156 rising-rate months from January 1973 to August 2026, US stocks returned -3.9%, 10-year Treasuries -1.5% and gold +8.8% a year, in US dollars after US inflation (calculation data). Rising-rate months have a fed funds rate more than one percentage point above its year-earlier level; falling-rate months use the reverse rule. Returns are annualised across non-consecutive months, not measured from a strategy someone could have held continuously.
Stocks and bonds both lost purchasing power in the rising-rate group. Gold and commodities gained, but struggled when rates fell. The four-asset mix had a positive real return in both groups, at the cost of much lower returns than 60/40 when rates fell. Gold and commodity data use monthly-average spot prices; commodities are not an investable fund return.
Why rates rise also matters. Inflation can hurt shares and bonds together; a growth slowdown can make government bonds useful again (AQR). See the 14 Fed hiking cycles and the 1970s for the history.
Diversify the risks, then choose the weights
The Sharpe ratio measures return above cash per unit of volatility, or how widely returns swing. Sharpe ratio optimisation seeks the mix with the best ratio; combining investments that move differently can improve it.
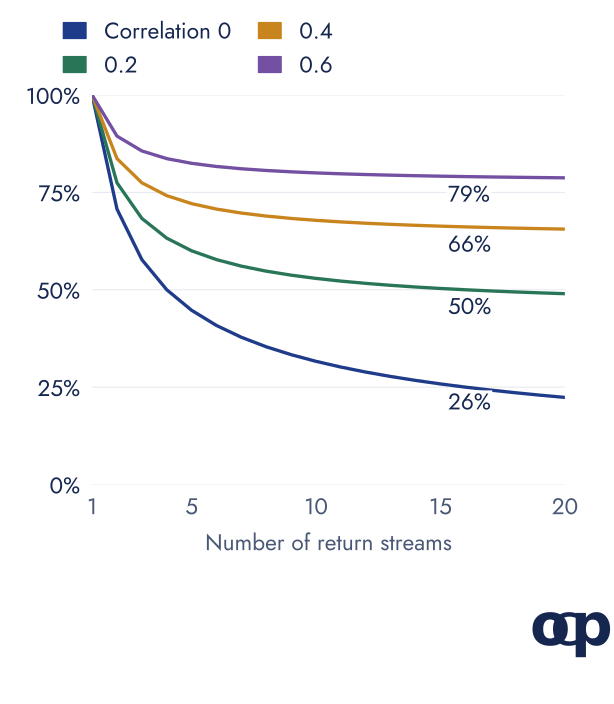
With 15 equally weighted streams of equal volatility, combined volatility is 26% of one stream's volatility at zero correlation, but 79% at an average correlation of 0.6 (using √(1/N + (1 − 1/N) × correlation), where N is the number of streams). This is diversification arithmetic, not a promise of higher returns. Fifteen tech shares can still behave like one investment. At September 2026, information technology already made up 31.78% of MSCI World (MSCI).
Historical optimisation has a trap: weights fitted to decades of falling rates can fail when inflation returns. Our Sharpe ratio explainer explains how to compare mixes and why their future performance can differ from past results. Our two tech articles explain rate sensitivity and what happened in past cycles.
Three state investors, three useful disciplines
- New Zealand: make every investment earn its place. Active strategies are measured against a simple 80/20 share-and-bond benchmark. Read the NZ Super Fund study.
- Norway: write the rules before the shock. Its 70/30 benchmark rebalances when the equity share leaves a 68-72% band at month-end. Read the Norway study.
- Singapore: give assets a job. GIC's 2026 framework groups investments around growth, income and inflation. Read the Singapore study.
Their long horizons and access to private investments differ from a household's. Their decision rules are more transferable than their allocations.
Four questions for your portfolio
- When will I need the money? A long recovery is harder to bear when a house purchase or retirement is close.
- Which risks am I repeating? Add up overlapping funds, single tech shares and the rate sensitivity of long bonds.
- What if shares and bonds fall together? Express the loss in euros as well as percentages.
- What will trigger rebalancing? A written schedule or allocation band reduces the need to forecast the next central-bank decision.
The right mix depends on the household's needs and ability to hold through losses. No asset, optimiser or sovereign fund removes that trade-off.
Sources and data
Copio calculations use monthly US market and Treasury-bill returns from the Kenneth French Data Library, Treasury yields from the Federal Reserve, BLS inflation and World Bank gold and commodity prices. Bonds are modelled at constant 10-year maturity; portfolios rebalance monthly without costs or taxes. Monthly-average spot prices smooth volatility. The missing October 2025 CPI observation is interpolated. US-dollar results are not euro returns; exchange rates and local inflation also matter. The linked studies explain the calculations and fund policies.
Data checked on 15 October 2026.
This article is for information and education, not personalised investment advice. Past performance is not a reliable indicator of future performance.