Higher yields hurt the price of bonds already owned, but improve the income available from new purchases. Two numbers help explain the trade-off: duration, which measures price sensitivity, and starting yield, which anchors the income an investor can earn.
Duration in one worked example
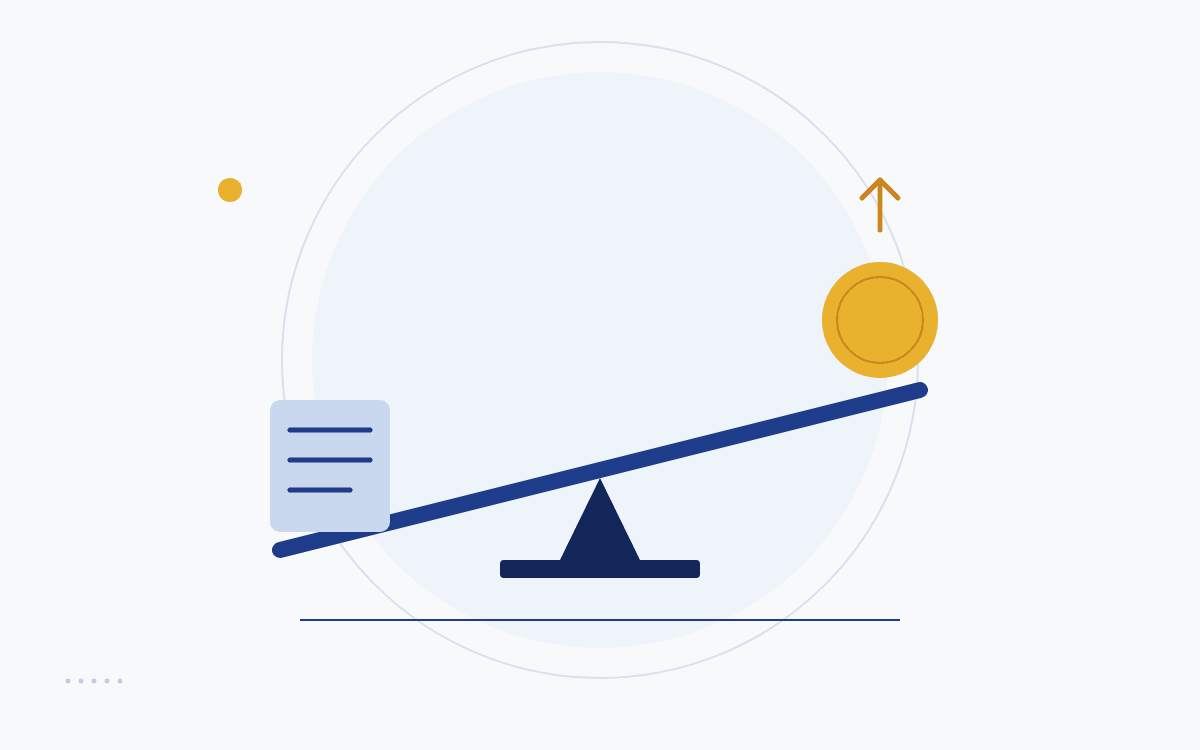
A bond portfolio with modified duration 7 loses roughly 7% if its yield rises by one percentage point. On €10,000, that is about €700 of immediate price loss, before income. If those bonds were bought at face value with a 4% coupon, €400 of annual coupon income would offset part of that loss over a year.
This is an approximation: it ignores changing duration, convexity, reinvestment, defaults, fees and taxes. It explains why the label “government bond” tells us too little about short-term risk. Longer maturities and lower coupons usually mean greater sensitivity.
Two shocks, very different recoveries
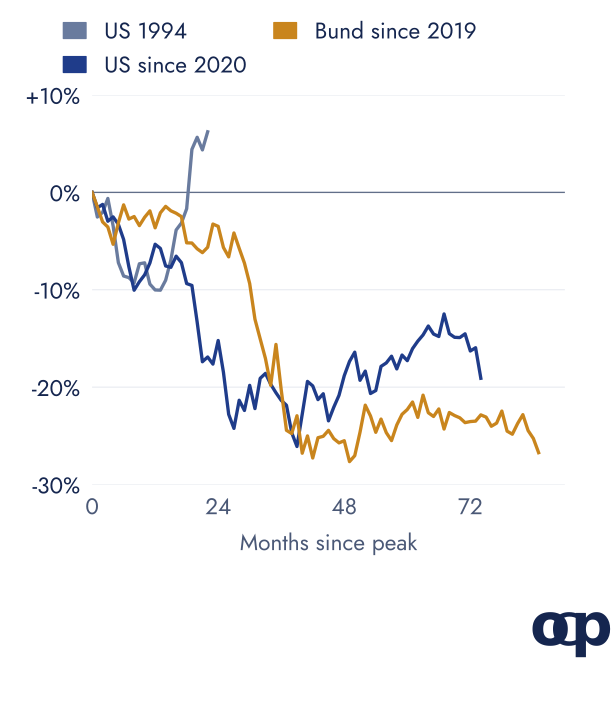
Copio calculation from US and German government yields, with income reinvested, in each bond's local currency, through September 2026 (drawdowns and starting-yield data). These are rolling constant-maturity investments, not individual bonds held to maturity.
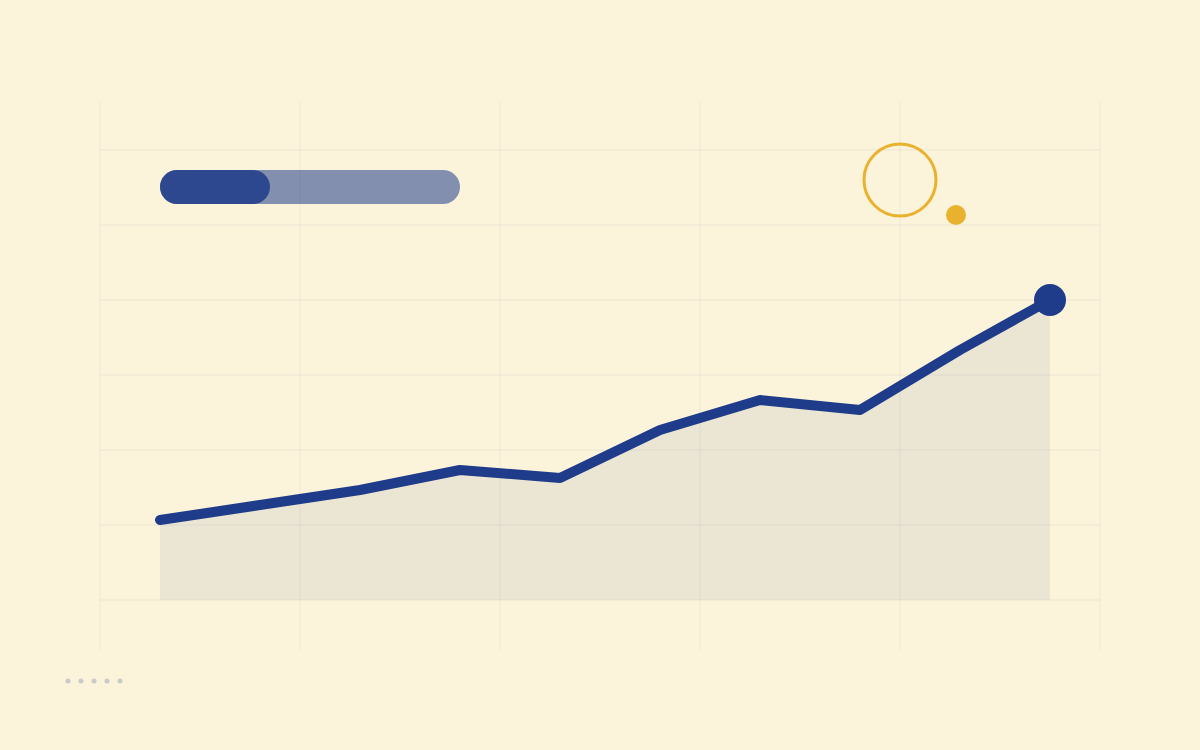
The US 1994 loss reached 10.0% and recovered in 19 months. Starting from July 2020's much lower yields, the later US loss reached 26.1%, and the investment remained 19.1% below its peak after 74 months. Low starting income left less room to absorb higher yields.
Starting yield gives useful context
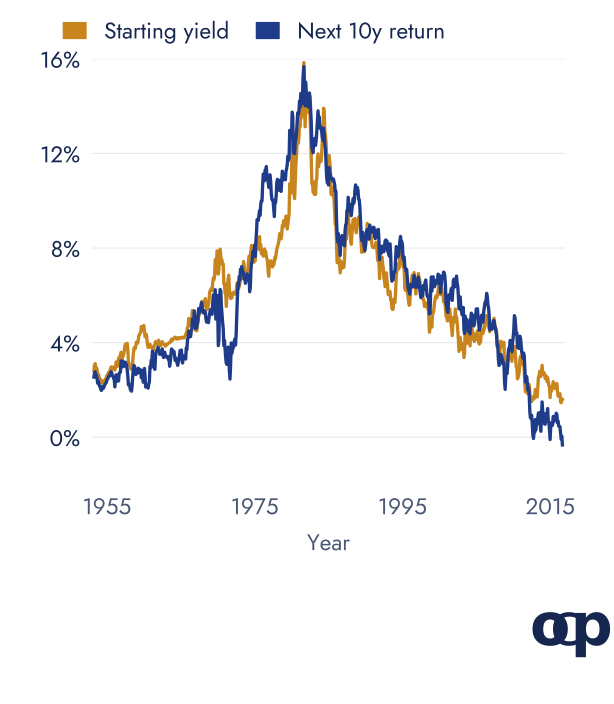
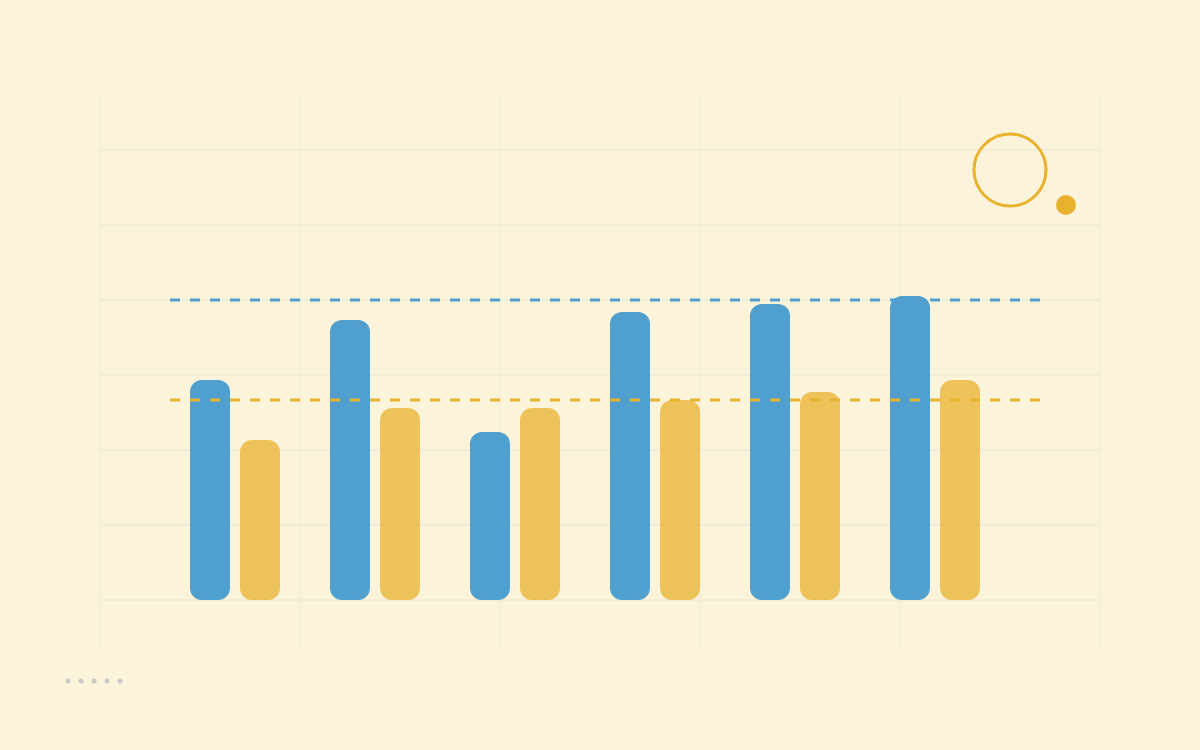
Across 762 monthly US 10-year Treasury starting points from April 1953 to September 2016, copio calculated a 0.945 correlation between starting yield and the following ten years' annualised total return in US dollars. The average absolute gap was about one percentage point a year. That is a historical relationship, not a guarantee; overlapping ten-year windows are not independent observations.
The investor's horizon matters. Higher income helps someone able to keep investing, but does not undo a loss for someone forced to sell today.
Match the bond to the job
- Short bonds and cash: less sensitivity to rate changes, but the reinvestment rate can fall quickly when central banks cut.
- Long bonds: larger price swings and more exposure to inflation, but potentially useful when growth weakens and yields fall.
- Inflation-linked bonds: payments adjust for inflation, yet their prices can still fall when real yields rise. The Bloomberg UK Government Inflation-Linked Bond Index lost 34.48% in sterling in 2022, as reported in a tracking fund’s factsheet.
- A ladder of individual bonds: maturities can align with known spending dates, subject to issuer risk. A bond fund continually replacing its holdings has a different return path.
Three checks before treating bonds as protection
- Duration: what would a one-point rise in yield do to the value?
- Timing: when is the money needed, and is the holding's maturity or duration compatible with that need?
- Shared risks: could inflation make the bonds and shares fall together?
The 1970s and Norway's 2022 experience show why a good issuer does not ensure a stable portfolio. The wider rising-rates framework considers bonds alongside other sources of return.
Sources and data
Copio models a 10-year par bond, reprices it after one month, adds coupon income, then rolls back to ten years. US yields come from Federal Reserve H.15; German yields from the Bundesbank. The paths use nominal total returns in local currency, without fees or taxes, through September 2026. The starting-yield study uses monthly US starts from April 1953 to September 2016 and the following ten years' returns. These are models, not investable fund results. The cited 2022 inflation-linked return is an index return reported in a tracking fund's factsheet, not a product recommendation.
Data checked on 15 October 2026.
This article is for information and education, not personalised investment advice. Past performance is not a reliable indicator of future performance.