Norway turns oil revenue into global investments and uses a spending rule to preserve wealth for future generations. Its roughly 70% share, 30% bond benchmark is simple, transparent and still capable of large losses. In 2022 the fund lost 14.1%, with shares and bonds falling together.
When the bond cushion failed
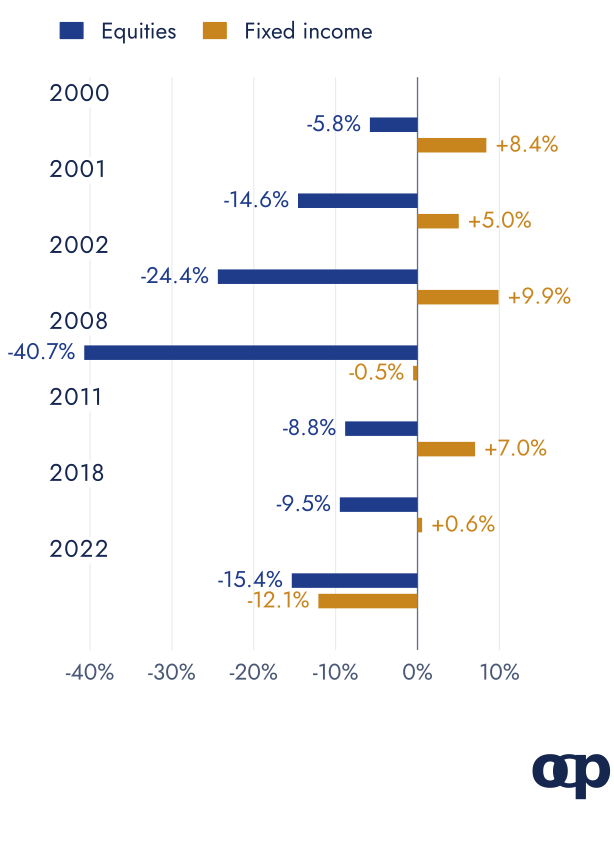
Source: NBIM annual returns, in the fund's currency basket, before management costs. The chart selects losing equity years from 1999-2025; it is not the fund's complete return history.
In 2022, equities returned -15.4% and bonds -12.1%. In the six other losing equity years, bonds gained or, in 2008, lost only 0.5%. Inflation exposed the shared sensitivity to rising discount rates (2022 annual report).
The rules connect investing to spending
The Government Pension Fund Global receives the state's petroleum cash flow and helps finance the non-oil budget deficit. Its purpose is to let present and future generations benefit from oil wealth (NBIM).
Three rules do much of the work:
- A 70/30 benchmark sets the main risk exposure. Bonds are split between government and corporate debt.
- A rebalancing band returns the equity allocation towards target when it leaves 68-72% at month-end (benchmark rules).
- A fiscal rule links spending over time to the expected real return, estimated at 3% a year, rather than spending each year's market gains (NBIM’s explanation of the fiscal rule).
The 3% figure is a long-run planning assumption, not a guaranteed yield or a compulsory annual withdrawal. Spending can be smoothed through economic conditions.
Stress tests make the loss concrete
NBIM replayed the January-September 2022 shock on its end-2025 portfolio and estimated a 19.8% loss (stress test). That is a scenario, not a prediction, and it differs from the realised full-year 2022 return.
The household equivalent is to translate a plausible shock into money. A 20% loss on €50,000 is €10,000. Whether that is bearable depends on spending needs and available cash, not only on an investor's willingness to take risk.
Private assets are not a guaranteed shelter
Norway's unlisted real estate returned 0.1% in 2022, while listed real estate companies lost 26.3%. The unlisted property book then lost 12.4% in 2023, as higher real rates and weaker office demand fed into valuations (2023 annual report). Slow-moving valuations can delay a loss rather than prevent it.
The transferable lesson is discipline
- Link the allocation to future spending. A portfolio is a source of purchasing power, not just an account balance.
- Set rebalancing rules in advance. Rules reduce dependence on forecasting the next turn.
- Keep costs visible. Norway's management costs were 0.04% of assets in 2025 (annual report), although its scale is far beyond a household's.
Norway's policy choices differ from the active approach of New Zealand and the reserve framework of Singapore. The common starting point is a clear purpose and an explicit tolerance for losses. See the portfolio framework and Sharpe ratio explainer for how those choices affect diversification.
Sources and data
The chart uses NBIM's published asset-class returns in the fund's international currency basket, which excludes Norwegian-krone movements, before management costs. It includes all negative equity years from 1999 to 2025. NBIM gives no equity return for 1998; the download also includes first-half 2026, clearly marked as a partial year. Calendar-year figures hide intra-year losses, and the fund's equity target has changed over time, so its whole-fund history is not a constant 70/30 backtest. Property valuations can lag public markets. The stress test uses an end-2025 portfolio and a nine-month historical shock.
Data checked on 15 October 2026.
This article is for information and education, not personalised investment advice. Past performance is not a reliable indicator of future performance.