Household financial assets: country, age and distribution
In France, median financial assets were €20,600 among households holding them, while the mean was €81,600. The threshold for the top tenth was €176,100. Those three figures describe the same national population in the ECB’s latest household survey, published in October 2026. A single average hides much of the distribution.
These are gross financial assets: deposits, investments and other financial holdings before deducting debts. They exclude property and public or occupational pension rights. A modest balance in this measure can coexist with substantial housing wealth or pension entitlements. For private investing, the useful question is how much financial capital is available to grow after spending commitments and debts are accounted for. A national median cannot answer that question, or show whether the assets could remain invested through a crash.
Key takeaways
Use the distribution as context for an asset inventory. France’s €20,600 median and €81,600 mean describe very different positions; neither is a personal target.
Separate existing wealth from investable capital. Property and many pension rights sit outside these figures, while deposits needed for spending sit inside them.
Examine how the balance could compound. Contributions, costs, concentration and the need to sell during losses affect future private wealth; age-group medians do not reveal those mechanisms.
The country distribution
Each line covers the middle 80% of holders, from the 10th to the 90th percentile. The dot marks the median: half of holders have less, half have more. The endpoints are percentile thresholds, not the smallest and largest balances in the country.
In France, the lowest tenth held about €600 or less in financial assets, while the highest tenth held about €176,100 or more. Germany’s corresponding thresholds were €800 and €218,300. A country can therefore have a large aggregate stock of financial assets and a much smaller median household balance.
The means also sit well above the medians in Germany (€87,400 versus €27,600) and Belgium (€115,500 versus €39,700). The mean answers how much there is per holder on average; the median identifies the middle of the distribution. The country download includes means and every published decile from the 10th to the 90th.
Age changes the national comparison
France and Germany have similar medians in the youngest band: €10,200 and €9,900. At 55-64, Germany’s median is €46,500, against €26,900 in France. Belgium’s median peaks at 45-54 among these working-age groups, while Austria’s 55-64 estimate is also below its 45-54 estimate. The pattern is not a uniform rise with age.
Age refers to the household’s reference person, and the balance belongs to the household rather than one individual. Each cell describes a different set of households. The comparison cannot separate lifetime accumulation from differences between generations, inheritances, household formation or housing choices.
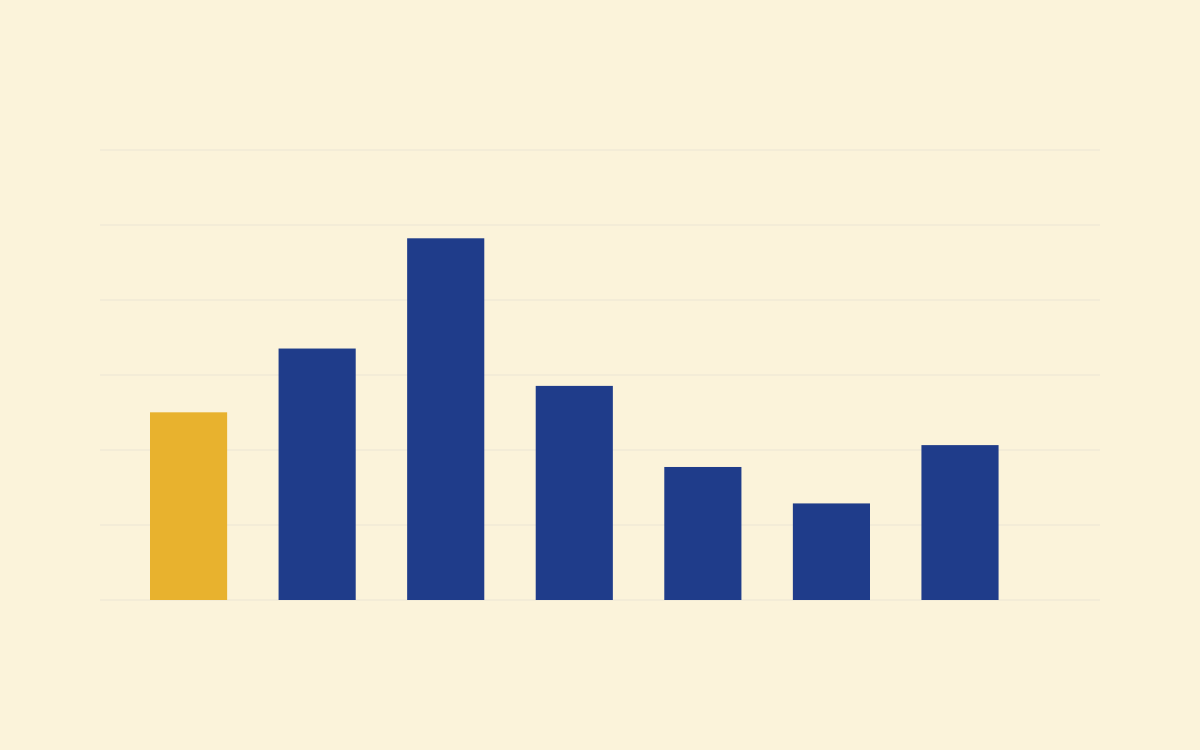
The distribution chart above covers all ages; this chart gives a median within each age group. The published tables do not provide a full set of deciles for each country-and-age combination. The age download also includes ages 65-74 and 75+.
Why the balances can look low
The euro-area median of €23,400 for ages 55-64 is a valid published figure, but it pools different national distributions. It is also a narrow measure of wealth. A paid-off home is absent, mortgage debt is not deducted, and many pension entitlements are outside the financial-assets total.
Financial assets here include deposits, funds, bonds, shares, money owed to households, voluntary pension plans, whole-life insurance and other financial holdings. Deposits alone can make a household a financial-asset holder. The measure is therefore broader than a stock-market portfolio and narrower than total household wealth.
Pension coverage also complicates comparisons between countries. Occupational pension rights can support future income without appearing in these balances; the pension funding study examines a separate question: the resources available to pay benefits in France. The survey figures cannot establish that a household has enough for retirement, or that a country with a lower median has worse overall financial security.
Assess the capital available to invest
A household’s position in a percentile chart says little about whether its financial assets can support long-term growth. A practical inventory separates money committed to near-term spending from investment assets, and records debts alongside both. This makes the private-investing part of the financial plan visible without treating an age-group median as an amount to aim for.
The next checks concern the portfolio’s ability to compound:
Exposure: identify dependence on one company, sector or market across all holdings.
Liquidity: identify spending and debt commitments that could require selling after a fall.
Progress: separate new contributions from investment returns and compare growth after inflation and costs.
A balance can grow because more money was added even while its investments lost value. Conversely, a market rally can conceal that contributions have stopped. The contribution and compounding study separates these effects and shows why losses belong in a growth assessment.
The survey itself cannot show that any particular investment strategy caused the observed wealth differences, or that the largest balances came from the best strategy.
Sources and method
ECB HFCS 2023 statistical tables, October 2026, table C3 for the distribution and table C4 for age-group medians. Both describe households holding financial assets. Amounts are published nominal euros, without inflation or purchasing-power adjustments between countries. Sampling uncertainty and country-specific collection differences also affect comparisons.
The methodological report, table 2 gives the national reference dates. France, Germany and Austria measured wealth at interviews in 2023-2024; Belgium and the Netherlands did so in 2023. Spain’s interviews ran from October 2022 to June 2023; Italy’s wealth reference date was 31 December 2022. The 2023 wave is the latest published wave, not a snapshot of balances in October 2026.
Published by copio for information and education. These statistics do not recommend an asset balance, portfolio or savings rate.
FAQ
Are these net financial assets or net worth?
Neither. They are gross financial assets, including deposits and investments, among households holding financial assets. Debts are not deducted. Housing and public or occupational pension rights are outside this measure.
Why is the mean so much higher than the median?
The mean divides total financial assets by the number of households holding them. The median is the middle balance among holders. Large balances in the upper part of the distribution pull the mean above the median. In France, the mean was €81,600 and the median €20,600.