Household saving rates in Europe: the 2025 country data
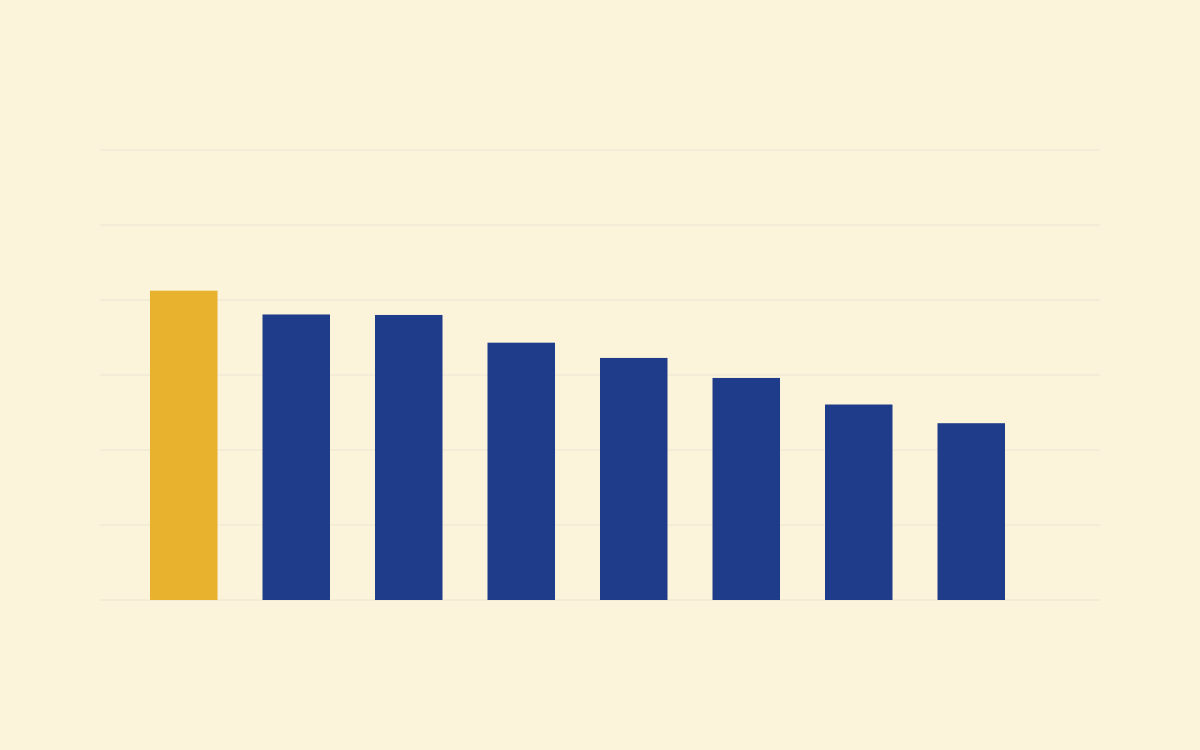
France’s household saving rate was 17.4% in 2025, compared with 18.9% in Germany and 14.8% across the euro area. These Eurostat figures measure the share of household-sector income saved. For France, that is about €17.40 saved from every €100 of adjusted disposable income.
A saving rate describes the flow of money left after consumption. Building private investment assets also depends on where that money goes and whether it can remain invested through losses. The practical question is how much of the surplus is available for long-term compounding after near-term spending and debt commitments.
Key takeaways
Measure the flow into investments. France’s 17.4% saving rate includes uses other than buying investments, so saving and investing need separate measures.
Check whether contributions can continue. Six of seven country rates fell in 2025; the capacity to add money can change with income and spending.
Judge growth after losses. A contribution rate is one input to private wealth accumulation; inflation, costs and compounded returns determine what that money becomes.
How much income was saved?
These seven countries are selected comparisons, not the full range of European saving rates.
Germany’s 18.86% rate exceeded France’s 17.41% by 1.45 percentage points before rounding. France and the Netherlands both display as 17.4% in the chart, but their published values are 17.41% and 17.38%. The small difference should not be read as a firm ranking, particularly while both estimates are provisional.
The euro-area figure is a ratio of totals across its members. It is not a simple average of the country percentages, and it cannot be used to infer the median household’s saving rate.
The change from 2024
France’s rate fell from 18.04% to 17.41%, a decline of 0.63 percentage points. Germany’s fell from 19.59% to 18.86%, while Austria’s fell from 17.31% to 15.69%. The Netherlands moved in the other direction, from 16.66% to 17.38%.
A falling rate means saving was smaller relative to income. It does not, on its own, establish that the amount saved in euros fell: income may also have changed. The downloadable data includes both the rates and their underlying income and saving totals.
For a more recent aggregate observation, the euro-area rate was 14.2% in Q2 2026, seasonally and calendar adjusted. That quarterly figure is kept separate from the full-year 2025 country comparison.
What counts as saving?
Eurostat defines the gross household saving rate as gross saving divided by gross disposable income plus the net adjustment for changes in pension entitlements. The sector covers households and non-profit institutions serving households.
“Gross” here means before deducting depreciation of fixed assets. It does not mean income before income tax: disposable income already reflects taxes and social contributions. The pension adjustment also means the denominator is broader than take-home pay received in a bank account.
Saving is the part of that income left after consumption. It can finance purchases of assets or repayment of debt; the statistic does not identify a transfer into an investment account. The saving-versus-investing comparison examines how the assets holding saved money affected its purchasing power in a historical example.
From saving to investing
Making private investing a priority starts with distinguishing available capital from money already committed elsewhere. A useful account of household saving separates money for near-term needs, debt repayment and additions to long-term investments. The national saving rate cannot make that split for an individual household.
Three checks turn the statistic into a planning exercise:
Track contributions separately from returns: a rising portfolio balance can come from new money, market gains or both.
Identify spending that could force a sale: money needed during a downturn cannot necessarily wait for a recovery.
Compare compounded purchasing power: examine what remains after gains, losses, inflation and costs, alongside the size of possible drawdowns.
Contributions create capital; liquidity and risk exposure affect whether it can stay invested. The compounding study explains why a high average return can still leave a balance smaller. Here, private investing means personally owned investment assets alongside mandatory pensions.
Sources and calculation
Country rates come from Eurostat tec00131, updated on 28 October 2026. The quarterly aggregate comes from teina500. The euro-area series uses the 21-country definition.
We independently reproduced each annual rate from Eurostat’s sector accounts, using the published formula: gross saving divided by disposable income plus pension adjustments receivable minus pension adjustments payable. The resulting ratios match the published percentages to their reported precision.
Published by copio for information and education. These national statistics do not recommend a personal savings rate or investment.
FAQ
What does a saving rate of 17.4% mean?
In France in 2025, gross saving was about €17.40 for every €100 of household-sector disposable income after the pension-entitlement adjustment. It does not mean that 17.4% of households saved, or that a typical household saved 17.4% of its own income.
Is the national saving rate an investment contribution rate?
No. National accounts measure income left after consumption, including the pension-entitlement adjustment. Saving can finance assets or debt repayment. The rate does not identify amounts paid into investment accounts.