Higher rates reduce the present value of future profits, which can make fast-growing tech companies especially sensitive. But earnings can rise at the same time. Understanding both forces is more useful than assuming that every rate hike means falling tech shares.
Why distant profits are more sensitive
A share's value depends on future cash flows discounted back to today. The discount rate includes a return available from safer assets plus compensation for business risk. Raising that rate reduces what investors will pay for a fixed stream of future cash.
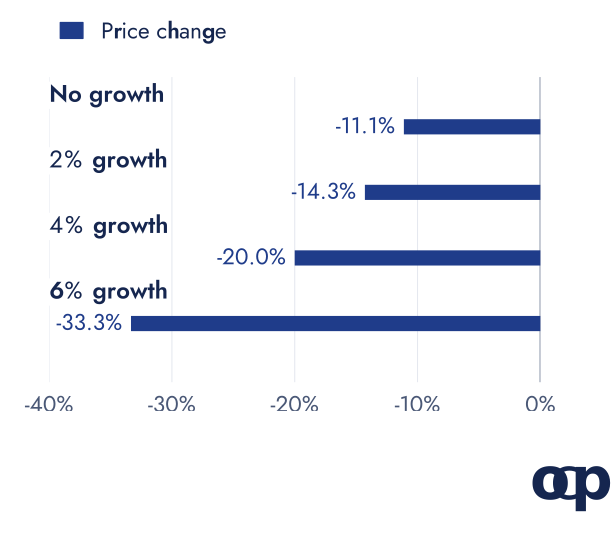
In copio's constant-growth illustration, increasing the discount rate from 8% to 9% reduces value by 33.3% at 6% perpetual growth, versus 11.1% at zero growth, with next year's cash flow held fixed. This simple model explains the mechanism, not the expected move of a real company. Small changes to either growth or the discount rate have large effects when the gap between them is narrow.
2022 fits the theory; other years do not
The US 10-year real yield rose from -1.04% to 1.58% in 2022 (FRED). US tech lost 32.3% that calendar year, compared with 19.9% for the wider market, using Kenneth French's business-equipment industry portfolio.
Yet from 2003 to August 2026, the monthly correlation between real-yield changes and growth stocks' return minus value stocks' return was only -0.19 (Copio calculation). Rates explained one influence among several. The cycle-by-cycle study shows tech beating the market in half of the 14 completed Fed hiking cycles.
By 30 September 2026, MSCI World IT had returned 29.16% for the year on a net total-return basis in US dollars despite higher yields. The September FOMC minutes attributed the year's equity gains to stronger actual and expected earnings, while valuation multiples declined. Higher profits can offset a lower price paid for each unit of profit.
Count the tech you already own
At 30 September 2026, 31.78% of MSCI World was information technology, and 72.94% was US companies (MSCI). Some technology-related companies sit in other sectors, so the formal sector weight does not capture every exposure.
A world fund, a US fund, a Nasdaq fund and individual tech shares can repeatedly own the same businesses. Counting funds is therefore a weak measure of diversification. Long bonds can add another exposure to higher discount rates, even though they look very different from shares.
Three questions for a tech holding
- How much cash does it generate now? A profitable business and a distant promise can have very different sensitivities.
- Who funds the next stage? Heavy investment financed with new debt or equity creates additional dependence on financing conditions.
- What is the combined weight? Add direct holdings and the same companies inside funds before judging concentration.
Rate sensitivity alone is not a buy or sell rule. The Sharpe ratio explainer explains how return streams that move differently can reduce portfolio volatility. The series framework connects that idea to a household's horizon and capacity for losses.
Sources and data
The illustration uses price = next year's cash flow / (discount rate minus perpetual growth), with the discount rate rising from 8% to 9%. It assumes constant growth forever and does not forecast a company. The real-yield comparison uses FRED's 10-year TIPS yield and value-weighted growth and value portfolios from the Kenneth French Data Library, February 2003 to August 2026. Growth and value are proxies, not direct measures of equity duration. Calendar-2022 tech is the business-equipment industry; the 2026 figure uses MSCI World IT, a different universe. Returns are in US dollars; euro returns also depend on exchange rates.
Data checked on 15 October 2026.
- growth-minus-value correlations with real yields (CSV)
- Nasdaq-100 weekly correlations by year (CSV)
- tech-company bond issues with SEC sources (CSV)
- 30-year coupons against Treasury yields (CSV)
This article is for information and education, not personalised investment advice. Past performance is not a reliable indicator of future performance.