US tech beat the market in seven of the 14 complete Fed hiking cycles since 1954. Rates alone did not predict the winner. The path inside each cycle also mattered: a positive full-cycle return could contain a crash, and a recovery could begin before the final hike.
Tech versus the market in each cycle
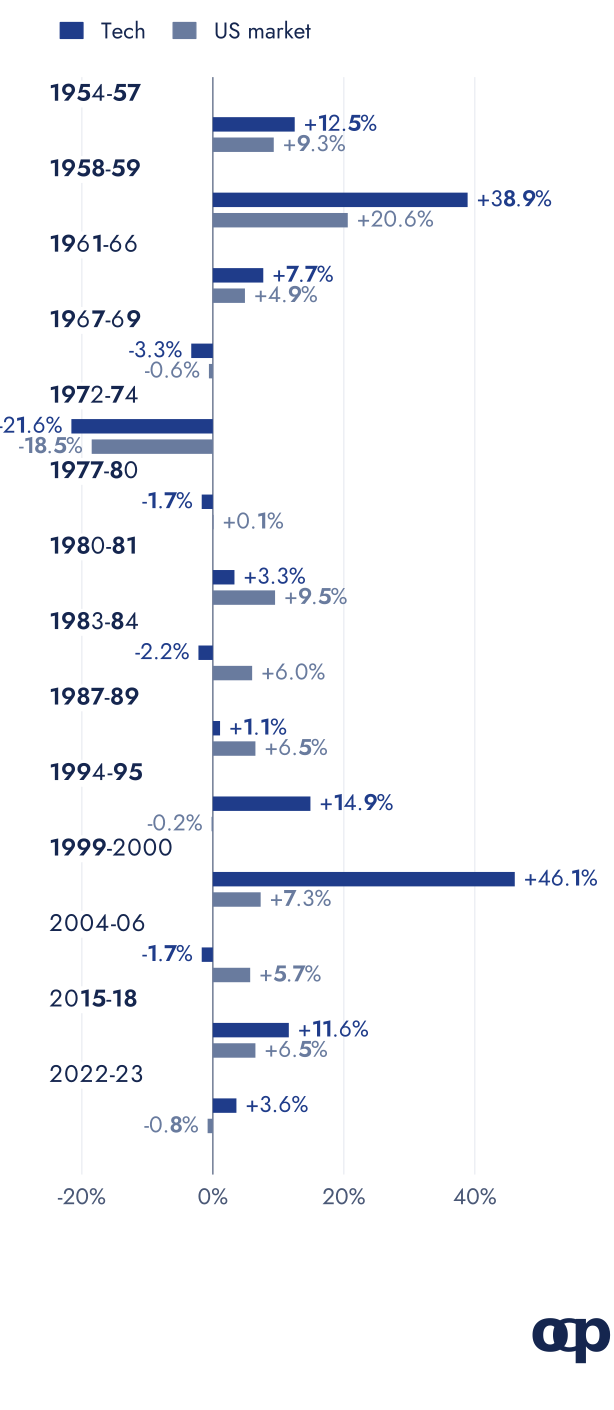
Copio calculation for 14 complete Fed hiking cycles from 1954 to 2023, in US dollars after US inflation, including the full calendar months of the first and last hike (cycle data; real returns). “Tech” is Kenneth French's business-equipment industry: computers, software and electronic equipment. It is not the Nasdaq, and its company membership changes over time.
The chart uses annualised returns so differently sized cycles can be compared. The episodes below instead describe cumulative price or total-return moves over their stated windows.
1999-2002: a boom during hikes, then a crash during cuts
The Nasdaq Composite rose 88.0% from the first June 1999 hike to its March 2000 peak. It then fell 77.9% to October 2002 and took 15 years to regain the peak on a price basis (FRED, Copio calculation).
The Fed's final hike came after the peak. Rate cuts did not prevent further losses once inflated expectations unravelled. A successful “hiking-cycle” investment could therefore become a very painful long-term holding.
2004-2006: tech lagged without collapsing
The Fed raised rates 17 times, from 1% to 5.25%. Business-equipment stocks returned +3.4% over the cycle, against +20.2% for the US market, before inflation. The difference was opportunity cost more than a dramatic nominal loss.
2022-2023: the recovery started before the hikes ended
The Nasdaq peaked in November 2021, before the first March 2022 hike. It was already 16.3% lower on that first-hike date. It lost 33.1% in calendar 2022, then gained 43.4% in 2023 while the Fed delivered four more increases (FRED, Copio calculation, price returns).
Across the complete 2022-23 hiking cycle, the business-equipment portfolio gained 12.5%, compared with 5.8% for the market, before inflation. Those full-cycle gains hide the severe loss along the way.
The mechanism still matters
Higher real yields reduce the present value of distant profits, all else equal. But earnings, valuations and expectations move too; the valuation explainer separates those forces.
In 2026 to 30 September, MSCI World IT returned 29.16% on a net total-return basis in US dollars while yields rose. That incomplete year is an example of the offsetting forces, not evidence that sensitivity to rates has disappeared.
What this means for a portfolio
- Count overlapping holdings. A world index already had 31.78% in information technology at September 2026 (MSCI).
- Measure the loss along the way. A full-cycle gain says little about whether an investor could have held through the trough.
- Write the rebalancing rule in advance. Central-bank dates are clearer in hindsight than in real time.
The wider portfolio framework and Sharpe ratio explainer focus on different sources of return rather than the next Fed announcement.
Sources and data
Copio uses value-weighted monthly total returns from the Kenneth French Data Library, US CPI and policy rates from FRED, and daily Nasdaq closes for the episode descriptions. Tech is the 12-industry business-equipment portfolio; Nasdaq figures exclude dividends. Full-cycle returns compound entire calendar months, including the first-hike and last-hike months. Cycle boundaries follow the method in the all-asset study; the incomplete 2026 cycle is excluded. Real returns divide total-return growth by CPI growth, then annualise for cycle length. Fourteen US cycles are a small sample; industry composition changes, inflation labels use hindsight, and no costs or taxes are deducted. US-dollar results do not include a euro investor's currency exposure.
Data checked on 15 October 2026.
- tech, growth and value in Fed hiking cycles (CSV)
- Fed hiking cycles 1954-2026 (CSV)
- growth-minus-value correlations with real yields (CSV)
- Nasdaq-100 weekly correlations by year (CSV)
- monthly historical inputs and returns (CSV)
This article is for information and education, not personalised investment advice. Past performance is not a reliable indicator of future performance.