Singapore connects long-term investing, government spending and retirement savings through distinct institutions. GIC manages government reserves, Temasek owns a commercial investment portfolio, and CPF members receive government-backed interest rather than GIC's investment return. The useful lesson is to assign money a clear purpose before choosing its risks.
GIC's mix has shifted
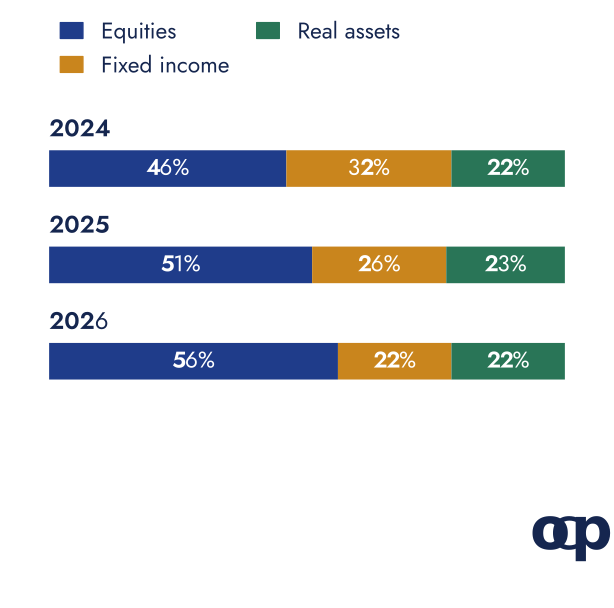
Sources: GIC reports 2024/25 and 2025/26. Between 31 March 2024 and 31 March 2026, GIC's reported equity weight rose from 46% to 56%, fixed income fell from 32% to 22%, and real assets were 22% at both endpoints (source-linked data).
From April 2026, GIC began moving beyond its former 65% equity, 35% bond reference portfolio towards a framework organised around three roles:
- Equities: growth.
- Fixed income: income.
- Real assets: inflation exposure.
The old 65/35 mix expressed the government's risk tolerance; it was not GIC's actual allocation. The new framework recognises that bonds may be less reliable diversifiers when inflation is persistent. GIC called 2022 a “watershed year” after shares and bonds fell together (2022/23 report). Real assets bring their own valuation, liquidity and interest-rate risks.
Lower risk also had a cost
Over the 20 years to March 2025, GIC returned 5.7% a year with 8.7% volatility, against 6.2% and 11.3% for the 65/35 reference portfolio (2024/25 report). It earned less, but its returns fluctuated less too.
Dividing return by volatility gives 0.66 versus 0.55 (Copio calculation). That is not a Sharpe ratio because no cash return has been deducted. The distinction matters when comparing it with the Sharpe ratio.
GIC's own headline measure is purchasing power: 3.4% a year after global inflation over the 20 years to March 2026. A rolling 20-year result changes when old years leave the window, as well as when a new year is added.
Different institutions carry different risks
MAS manages official foreign reserves alongside its monetary-policy responsibilities. GIC manages government assets over a long horizon without owning them. Temasek owns its portfolio and takes more concentrated commercial risks (Ministry of Finance).
Temasek reported S$518bn in net portfolio value and a 10.5% one-year return in Singapore dollars to March 2026, both on a mark-to-market basis (Temasek Review; archived report). That one-year Singapore-dollar result is not directly comparable with GIC's long-term real return.
What citizens receive
The budget can use up to half the expected long-term real return on the net assets invested by GIC, MAS and Temasek, alongside part of the income from other reserves. The Net Investment Returns Contribution uses expected returns to smooth spending and real returns to preserve purchasing power.
CPF retirement savings follow a separate promise. The Special, MediSave and Retirement Accounts have a 4% interest-rate floor through the end of 2027 (CPF Board). The Ordinary Account has different terms. Members' rates are not linked directly to GIC's returns; the government bears the investment risk (MOF).
Three questions a household can use
- What job does each holding do? Growth, near-term spending and inflation protection need different evidence.
- How much purchasing power can be spent? Nominal gains are not all available for consumption.
- Who bears the risk? A state-backed floor cannot be reproduced by buying a similar-looking portfolio.
Compare New Zealand and Norway, or return to the rising-rates portfolio framework.
Sources and data
Primary sources are GIC's annual reports, Temasek's 2026 review, Singapore's Ministry of Finance and the CPF Board, consulted on 15 October 2026. GIC nominal returns are annualised in US dollars; its real-return measure deducts global inflation. Temasek returns cited here are in Singapore dollars. Copio's return-to-volatility comparison divides matching published annualised figures without deducting a risk-free rate, so it must not be labelled a Sharpe ratio. The two downloads retain source URLs and the longer historical comparisons.
Data checked on 15 October 2026.
- GIC returns and volatility comparison, with source URLs (CSV)
- 20-year returns and portfolio mix, with source URLs (CSV)
This article is for information and education, not personalised investment advice. Past performance is not a reliable indicator of future performance.