The NZ Super Fund starts with a simple 80% share, 20% bond benchmark, then asks whether each active investment improves the whole portfolio. That discipline helped it lose less than its benchmark in the 2022 rate shock. It does not make the fund low-risk, or turn its allocation into a household template.
How it handled four shocks
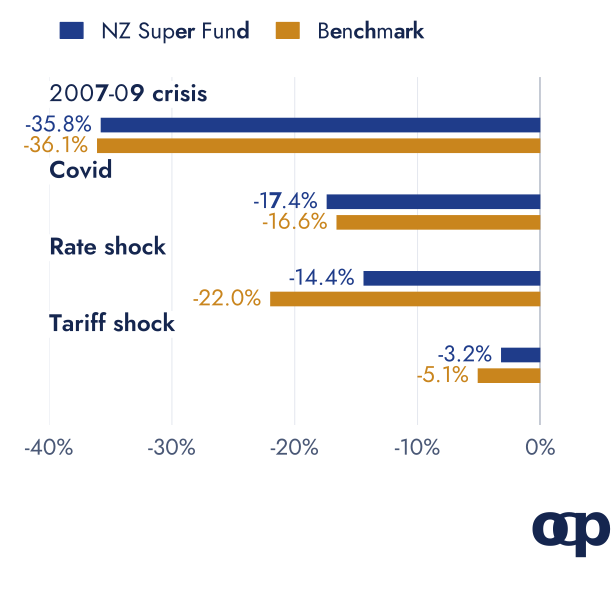
From December 2021 to September 2022, the NZ Super Fund's maximum month-end drawdown was 14.4%, against 22.0% for its reference portfolio, in NZ dollars after fees and before NZ tax (Copio calculation from the fund's monthly returns). These are peak-to-trough losses, not calendar-year returns. Before July 2010, the comparison uses the former strategic allocation benchmark.
In the year to June 2022, the fund lost 6.99%, while the reference portfolio lost 14.24%. The benchmark's global shares and bonds both fell; strategic tilting helped the fund weather the shock (2021/22 annual report). The chart also shows occasions when the fund did not outperform.
A benchmark that every investment must beat
The fund partly pre-funds New Zealand's universal state pension, spreading costs between today's taxpayers and future generations (2026 investment policies). Its long horizon allows it to own illiquid assets and withstand losses that could be impractical for an individual.
The reference portfolio is the passive alternative: what the fund could own without making active choices. Active investments must justify their extra risk and cost against an appropriate part of it. Infrastructure, for example, is funded against a blend of growth and income assets rather than treated as an entirely separate pot (2024/25 annual report).
This is a practical application of the Sharpe optimisation idea: judge an investment by its contribution to the portfolio's risk-adjusted return, not its standalone appeal.
Buying cheaper assets by a written rule
Strategic tilting increases exposure when assets look cheap relative to long-term value and reduces it when they look expensive. The fund's white paper describes a long-horizon approach relying on mean reversion, rather than short-term forecasting.
That requires both patience and liquidity. A price can keep falling after it looks cheap. The fund's liquidity policy aims to prevent forced selling during severe stress. A household investing its emergency reserve would lack the same freedom.
The 2026 change: less currency hedging
The five-year review retained the 80/20 reference allocation but reduced foreign-currency hedging from 100% to 70%, from the review scheduled to take effect on 1 July 2026. The current authority is the Portfolio Design Policy approved in August 2026; some older explanatory pages still describe the previous hedge.
Reducing the hedge changes how currency movements affect returns in New Zealand dollars. It is a policy choice for this fund's circumstances, not evidence that 70% is the right hedge for a euro saver.
What an individual can borrow
- A simple benchmark: compare a complex portfolio with a plausible low-cost alternative.
- A job for each holding: identify what risk or source of return it adds.
- A written process: define rebalancing and liquidity needs before markets become stressful.
The fund itself estimates a 52.6% loss under a replay of its 2008-2011 stress scenario, against 44.7% for the reference portfolio (risk estimates). Better results in 2022 did not remove the capacity for very large losses. Compare the different rules used by Norway and Singapore, or return to the portfolio framework.
Sources and data
Drawdowns compound the Guardians' monthly performance data into wealth indices and measure each episode's largest month-end fall. Figures are in NZ dollars, after fees and before NZ tax. The reference portfolio begins in July 2010; earlier figures use the previous benchmark. Monthly observations miss intra-month lows, and private-asset valuation intervals can dampen reported volatility. The spreadsheet is unaudited; annual figures in the text use the annual report. The stress loss is the fund's published scenario estimate, not a forecast or the realised drawdown in the chart.
Data checked on 15 October 2026.
- maximum drawdowns by episode (CSV)
- annual returns of the fund, benchmark and Treasury bills, 2003/04 to 2025/26 (CSV)
- fund, benchmark and Treasury-bill monthly returns (CSV)
This article is for information and education, not personalised investment advice. Past performance is not a reliable indicator of future performance.