US government bonds lost to inflation in 13 of the 14 complete Fed hiking cycles since 1954. Stocks were less predictable: they beat cash in 11 cycles, but suffered large losses in some inflationary episodes. The cause of the hikes mattered more than the fact that rates were rising.
Fourteen cycles, one picture
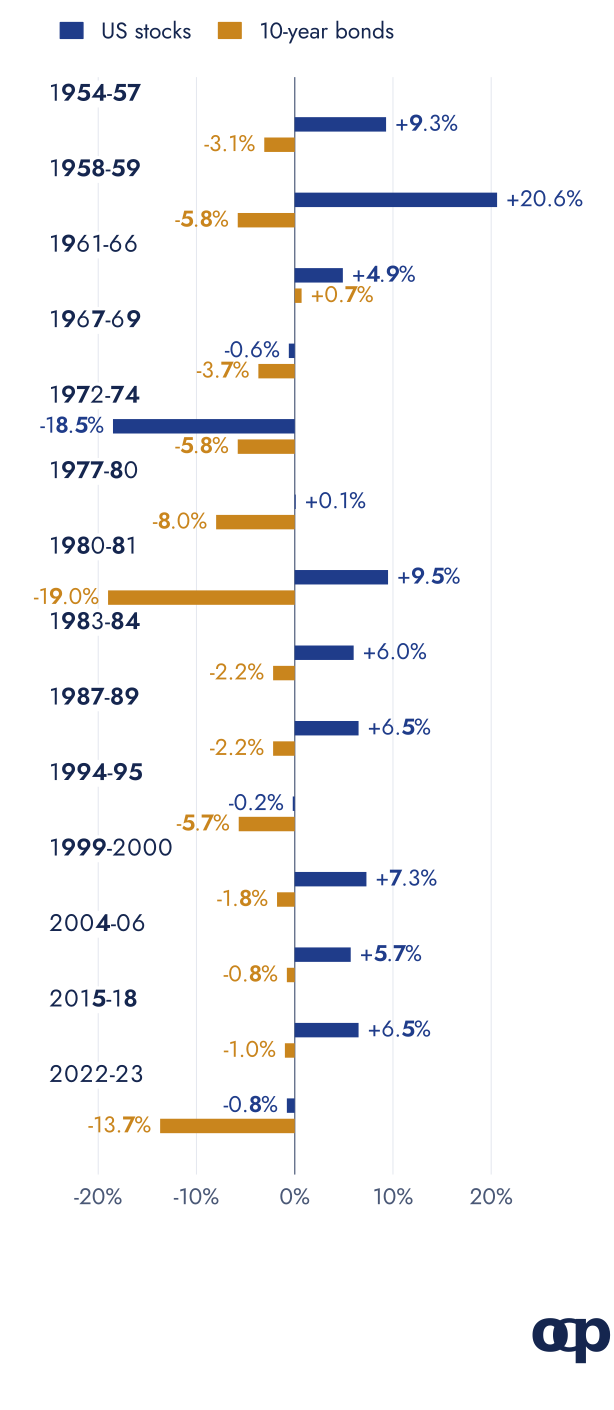
Copio calculation for 14 complete Fed hiking cycles from 1954 to 2023, covering the full calendar months containing the first and last hike in each cycle, in US dollars (cycle data and returns). These are annualised total returns after inflation, not the cumulative gain or loss over each differently sized cycle. The full stock, bond, cash, gold and 60/40 comparisons are in the downloadable data below.
Long bonds lock in an earlier coupon while newly issued debt pays more. Their prices fall to make up the difference. Short Treasury bills reset sooner: 10-year Treasuries failed to beat bills in all 14 cycles. That does not make cash a permanent inflation hedge; bills beat inflation in only nine.
Two kinds of rate rise
Inflation-driven cycles: US stocks averaged +1.3% a year after inflation; a monthly-rebalanced 60/40 stock-and-bond portfolio averaged -1.9%.
Growth or normalisation cycles: stocks averaged +7.7%; 60/40 averaged +3.5%.
Copio calculation across eight inflation-driven and six other cycles. We classify a cycle as inflation-driven if inflation starts at 4% or more, or rises by at least two percentage points during it. That second condition uses hindsight, so these labels are explanatory rather than a trading signal.
Inflation can squeeze profits while forcing bond yields higher. Strong growth can support earnings despite tighter monetary policy. That helps explain why the same rate direction produced different outcomes.
Gold's average hides a patchy record
Gold's average real return across the ten cycles since 1972 was +3.4% a year, but its median was -2.3%. Two huge 1970s gains pulled up the average. Gold lost to inflation in six of the other eight cycles.
The 1970s study shows both the inflation protection and the reversal that followed. One successful episode is a poor basis for treating any asset as an automatic hedge.
A central-bank date is not an entry signal
Markets anticipate decisions. Tech peaked before the final hike in 2000 and began falling before the first hike in 2022; it then rallied while rates were still rising in 2023. The tech history separates those paths from full-cycle returns.
The cycle begun by the September 2026 Fed increase is incomplete and excluded from the chart. It cannot yet tell us how the next completed cycle will rank.
What to take into a portfolio review
- Check duration. Long government bonds can lose heavily even when the issuer pays every coupon. How duration works.
- Test an inflation shock. Shares and bonds need not offset each other.
- Use several sources of return. The portfolio framework and Sharpe ratio explainer explain the diversification trade-offs.
Fourteen cycles are evidence, not a forecast, and a US-dollar history does not reproduce a euro investor's experience.
Sources and data
Copio calculation using the Kenneth French Data Library, Federal Reserve/FRED rates and CPI, and World Bank monthly-average gold prices. Cycles follow turning points in effective fed funds, confirmed by a 1.25-point reversal; upswings shorter than six months are merged or omitted. FOMC target dates are used from October 1982; earlier boundaries are approximate. Returns compound full calendar months, including the first-hike and last-hike months; they are not daily event-to-event returns. Real returns divide total returns by CPI growth; annualisation adjusts for cycle length. Bonds use a constant-maturity model, and 60/40 rebalances monthly. No fees or taxes; only 14 completed cycles, with uneven lengths and hindsight in the inflation labels.
Data checked on 15 October 2026.
- Fed hiking cycles 1954-2026: dates, rates, inflation, class, nominal and real returns (CSV)
- monthly historical inputs and returns (CSV)
This article is for information and education, not personalised investment advice. Past performance is not a reliable indicator of future performance.